An Unhealthy America: The Economic Burden of ... - Milken Institute
An Unhealthy America: The Economic Burden of ... - Milken Institute
An Unhealthy America: The Economic Burden of ... - Milken Institute
You also want an ePaper? Increase the reach of your titles
YUMPU automatically turns print PDFs into web optimized ePapers that Google loves.
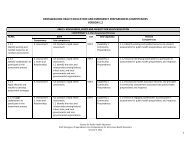
<strong>An</strong> <strong>Unhealthy</strong> <strong>America</strong><strong>Milken</strong> <strong>Institute</strong>CaliforniaCaliforniaDirect Costs2003 2023Avoidable Costs(US$ Billions)Projections - Level Projections - DifferencePRC (Thousands) Expenditure per PRC ($) Total Expenditure(US$ Billions) PRC (Thousands) Expenditure perPRC ($)Baseline Optimistic Baseline Optimistic Baseline Optimistic Absolute Percent Absolute Percent Absolute PercentTotal Expenditure(US$ Billions)Expenditure per PRC($)PRC(Thousands)Chronic DiseaseDiseaseExpenditures(Billions)PRC*(Millions)Cancer 48.1 10.6 4.5Breast Cancer 5.5 1.1 4.8Colon Cancer 3.9 0.3 11.5Lung Cancer 6.3 0.4 17.1Prostate Cancer 4.3 1.0 4.1Cancer 1,155 4,121 4.76 1,927 1,584 6,902 6,366 13.30 10.08 -343 -17.80 -536 -7.76 -3.22 -24.18Breast cancer 116 4,609 0.53 191 168 7,783 7,172 1.49 1.20 -24 -12.30 -611 -7.85 -0.29 -19.18Colon cancer 43 10,815 0.46 60 49 19,631 18,095 1.17 0.89 -11 -17.67 -1,536 -7.82 -0.28 -24.11Lung cancer 44 16,217 0.70 61 50 27,439 25,285 1.68 1.26 -11 -18.44 -2,154 -7.85 -0.42 -24.85Prostate cancer 108 3,755 0.40 199 156 6,459 5,952 1.28 0.93 -43 -21.48 -507 -7.84 -0.35 -27.64Other cancers 845 3,127 2.64 1,416 1,161 5,420 4,995 7.67 5.80 -255 -18.00 -425 -7.84 -1.87 -24.43Diabetes 1,573 1,904 2.99 2,586 2,242 3,281 3,023 8.48 6.78 -344 -13.30 -257 -7.84 -1.71 -20.10Heart disease 1,860 3,218 6.00 2,920 1,909 5,807 5,353 16.96 10.22 -1,011 -34.63 -454 -7.83 -6.74 -39.74Pulmonary conditions 5,301 826 4.37 6,982 6,001 1,462 1,348 10.21 8.09 -981 -14.05 -115 -7.83 -2.12 -20.79Hypertension 3,660 853 3.12 5,408 4,397 1,472 1,356 7.96 5.96 -1,011 -18.70 -115 -7.84 -2.00 -25.07Stroke 241 5,374 1.29 339 275 9,842 9,072 3.33 2.49 -64 -18.84 -770 -7.82 -0.84 -25.19Mental disorders 2,534 1,703 4.36 4,084 3,579 2,915 2,686 11.90 9.61 -504 -12.35 -229 -7.85 -2.29 -19.23Total 16,324 1,646 26.87 24,245 19,987 3,373 3,109 72.15 53.24 -4,258 -17.56 -264 -7.83 -18.91 -26.20Indirect Impacts* (US$ Billions)TotalLost Work Days Presenteeism Lost Work Days Presenteeism Projections - Level Projections - DifferenceBaseline Optimistic Baseline Optimistic Baseline Optimistic Baseline Optimistic Baseline Optimistic Absolute Percent2023Individual Caregiver2003TotalLevelChronic DiseaseCancer 29.60 5.49 4.48 92.75 55.14 0.40 0.32 8.97 5.83 107.60 65.78 -41.83 -38.87Breast cancer 3.31 0.61 0.54 10.39 6.59 0.04 0.04 1.01 0.70 12.06 7.86 -4.20 -34.84Colon cancer 2.90 0.48 0.40 8.17 4.86 0.03 0.03 0.79 0.51 9.48 5.80 -3.68 -38.82Lung cancer 4.40 0.69 0.56 11.72 6.90 0.05 0.04 1.13 0.73 13.59 8.24 -5.36 -39.41Prostate cancer 2.52 0.53 0.41 8.95 5.08 0.04 0.03 0.87 0.54 10.38 6.06 -4.33 -41.66Other cancers 16.47 3.17 2.58 53.52 31.71 0.23 0.19 5.18 3.36 62.09 37.83 -24.26 -39.08Diabetes 12.00 4.26 3.70 34.82 27.30 0.34 0.29 3.71 2.89 43.13 34.18 -8.95 -20.76Heart disease 10.17 6.78 4.43 24.64 13.47 0.67 0.43 2.38 1.30 34.47 19.64 -14.82 -43.01Asthma 10.09 5.76 4.95 20.51 16.67 0.42 0.36 1.99 1.62 28.69 23.60 -5.09 -17.74Hypertension 27.83 13.05 10.61 67.78 53.61 1.28 1.04 6.57 5.20 88.69 70.46 -18.23 -20.55Stroke 2.20 1.14 0.92 4.95 3.74 0.08 0.07 0.48 0.37 6.65 5.10 -1.55 -23.35Emotional disturbances 14.27 5.50 4.82 40.00 33.62 0.40 0.35 3.84 3.23 49.74 42.01 -7.73 -15.54Total 106.16 41.97 33.92 285.46 203.55 3.58 2.87 27.95 20.43 358.97 260.77 -98.20 -27.36* Based on Nominal GDPExpenditures/PRC(Thousands)Intergenerational Impacts2023 2023 2050 2050Projections - LevelProjections - Difference Projections - Level Projections - DifferenceOther Cancers 28.0 7.7 3.6Pulmonary Conditions 45.2 49.2 0.9Diabetes 27.1 13.7 2.0Hypertension 32.5 36.8 0.9Heart Disease 64.7 19.2 3.4Stroke 13.6 2.4 5.6Mental Disorders 45.8 30.3 1.5Total 277.0 162.2 1.7PRC: Population Reporting ConditionPercentBaseline Optimistic Absolute Percent Baseline Optimistic Absolute1970 2003VariablesBachelor's degrees (percent) 13.40 28.93 34.12 36.35 2.23 6.54 42.38 49.74 7.36 17.36Capital stock (US$ Billions) 822.81 2564.25 5803.59 6016.15 212.56 3.64 20134.27 22092.73 1958.46 9.72Life expectancy at 65 (years) 15.52 19.29 21.09 22.31 1.22 5.78 24.12 26.45 2.33 9.64GDP* by state (US$ Billions) 243.85 1468.90 2450.61 2621.31 170.70 6.97 5188.22 6096.22 908.00 17.50*Based on Real GDP[ 191 ]


