

An Unhealthy America: The Economic Burden of ... - Milken Institute
An Unhealthy America: The Economic Burden of ... - Milken Institute
An Unhealthy America: The Economic Burden of ... - Milken Institute

Create successful ePaper yourself
Turn your PDF publications into a flip-book with our unique Google optimized e-Paper software.
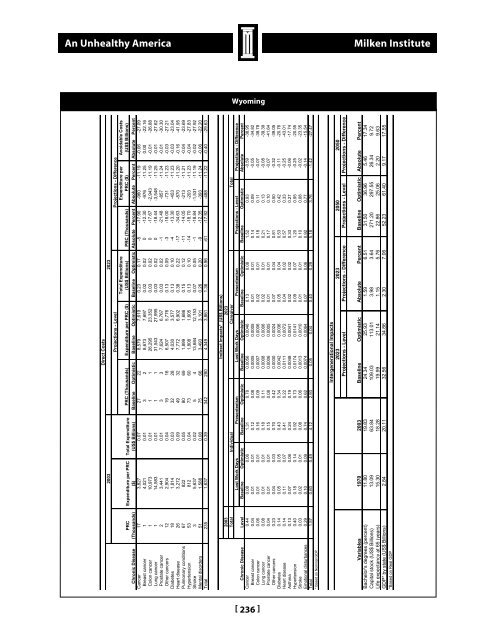
<strong>An</strong> <strong>Unhealthy</strong> <strong>America</strong><strong>Milken</strong> <strong>Institute</strong>WyomingWyomingDirect Costs2003 2023Avoidable Costs(US$ Billions)Projections - Level Projections - DifferencePRC (Thousands) Expenditure per PRC ($) Total Expenditure(US$ Billions) PRC (Thousands) Expenditure perPRC ($)Baseline Optimistic Baseline Optimistic Baseline Optimistic Absolute Percent Absolute Percent Absolute PercentTotal Expenditure(US$ Billions)Expenditure per PRC($)PRC(Thousands)Chronic DiseaseDiseaseExpenditures(Billions)PRC*(Millions)Cancer 48.1 10.6 4.5Breast Cancer 5.5 1.1 4.8Colon Cancer 3.9 0.3 11.5Lung Cancer 6.3 0.4 17.1Prostate Cancer 4.3 1.0 4.1Other Cancers 28.0 7.7 3.6Pulmonary Conditions 45.2 49.2 0.9Diabetes 27.1 13.7 2.0Hypertension 32.5 36.8 0.9Cancer 17 3,827 0.07 27 22 8,579 7,619 0.23 0.17 -5 -17.90 -960 -11.19 -0.06 -27.09Breast cancer 1 4,021 0.01 3 2 8,673 7,697 0.02 0.02 0 -12.30 -976 -11.25 0.00 -22.16Colon cancer 1 10,973 0.01 1 1 26,295 23,352 0.03 0.02 0 -17.67 -2,943 -11.19 -0.01 -26.88Lung cancer 1 14,583 0.01 1 1 31,543 27,995 0.03 0.02 0 -18.44 -3,548 -11.25 -0.01 -27.62Prostate cancer 2 3,441 0.01 3 3 7,624 6,767 0.03 0.02 -1 -21.48 -857 -11.24 -0.01 -30.30Other cancers 12 2,904 0.04 19 16 6,507 5,776 0.13 0.09 -3 -18.00 -731 -11.23 -0.03 -27.21Diabetes 18 1,814 0.03 32 28 4,030 3,577 0.13 0.10 -4 -13.30 -453 -11.23 -0.03 -23.04Heart disease 26 3,272 0.09 49 32 7,772 6,902 0.38 0.22 -17 -34.63 -870 -11.20 -0.16 -41.95Pulmonary conditions 67 822 0.05 80 69 1,899 1,686 0.15 0.12 -11 -14.05 -213 -11.21 -0.04 -23.69Hypertension 53 812 0.04 73 60 1,808 1,605 0.13 0.10 -14 -18.70 -203 -11.23 -0.04 -27.83Stroke 3 5,637 0.02 5 4 13,684 12,153 0.07 0.05 -1 -18.84 -1,531 -11.19 -0.02 -27.92Mental disorders 51 1,588 0.08 75 66 3,493 3,101 0.26 0.20 -9 -12.35 -393 -11.24 -0.06 -22.20Total 235 1,637 0.39 342 280 4,349 3,861 1.36 0.96 -61 -17.92 -488 -11.22 -0.40 -29.63Indirect Impacts* (US$ Billions)2023Individual Caregiver Total2003TotalLost Work Days Presenteeism Lost Work Days Presenteeism Projections - Level Projections - DifferenceBaseline Optimistic Baseline Optimistic Baseline Optimistic Baseline Optimistic Baseline Optimistic Absolute PercentLevelChronic DiseaseCancer 0.44 0.08 0.06 1.31 0.78 0.0056 0.0046 0.13 0.08 1.52 0.93 -0.59 -38.95Breast cancer 0.04 0.01 0.01 0.12 0.08 0.0005 0.0005 0.01 0.01 0.14 0.09 -0.05 -34.82Colon cancer 0.06 0.01 0.01 0.16 0.09 0.0007 0.0006 0.02 0.01 0.18 0.11 -0.07 -38.78Lung cancer 0.08 0.01 0.01 0.18 0.11 0.0008 0.0006 0.02 0.01 0.21 0.13 -0.08 -39.39Prostate cancer 0.04 0.01 0.01 0.15 0.08 0.0006 0.0005 0.01 0.01 0.17 0.10 -0.07 -41.64Other cancers 0.23 0.04 0.03 0.70 0.42 0.0030 0.0024 0.07 0.04 0.81 0.50 -0.32 -39.05Diabetes 0.14 0.05 0.05 0.43 0.34 0.0042 0.0036 0.05 0.04 0.53 0.42 -0.11 -20.76Heart disease 0.14 0.11 0.07 0.41 0.22 0.0111 0.0072 0.04 0.02 0.57 0.33 -0.25 -43.01Asthma 0.13 0.07 0.06 0.24 0.19 0.0048 0.0041 0.02 0.02 0.33 0.27 -0.06 -17.74Hypertension 0.40 0.18 0.14 0.92 0.73 0.0174 0.0141 0.09 0.07 1.20 0.95 -0.25 -20.55Stroke 0.03 0.02 0.01 0.08 0.06 0.0013 0.0010 0.01 0.01 0.10 0.08 -0.02 -23.35Emotional disturbances 0.29 0.10 0.09 0.74 0.62 0.0074 0.0064 0.07 0.06 0.92 0.77 -0.14 -15.54Total 1.57 0.60 0.49 4.12 2.93 0.05 0.04 0.40 0.29 5.18 3.76 -1.42 -27.47* Based on Nominal GDPIntergenerational Impacts2023 2023 2050 2050Projections - Level Projections - Difference Projections - Level Projections - DifferenceExpenditures/PRC(Thousands)Baseline Optimistic Absolute PercentBaseline Optimistic Absolute Percent1970 2003VariablesBachelor's degrees (percent) 11.80 19.83 24.34 25.93 1.59 6.51 31.50 36.96 5.46 17.34Capital stock (US$ Billions) 13.09 63.84 109.03 113.01 3.98 3.64 271.20 297.55 26.34 9.72Life expectancy at 65 (years) 15.30 18.28 19.99 21.14 1.15 5.76 22.86 25.06 2.20 9.63GDP* by state (US$ Billions) 2.84 20.11 32.56 34.86 2.30 7.06 52.23 61.40 9.17 17.55*Based on Real GDPHeart Disease 64.7 19.2 3.4Stroke 13.6 2.4 5.6Mental Disorders 45.8 30.3 1.5Total 277.0 162.2 1.7PRC: Population Reporting Condition[ 236 ]


