An Unhealthy America: The Economic Burden of ... - Milken Institute
An Unhealthy America: The Economic Burden of ... - Milken Institute
An Unhealthy America: The Economic Burden of ... - Milken Institute
You also want an ePaper? Increase the reach of your titles
YUMPU automatically turns print PDFs into web optimized ePapers that Google loves.
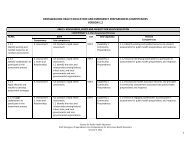
<strong>An</strong> <strong>Unhealthy</strong> <strong>America</strong><strong>Milken</strong> <strong>Institute</strong>IndianaIndianaDirect Costs2003 2023Avoidable Costs(US$ Billions)Projections - Level Projections - DifferencePRC (Thousands) Expenditure per PRC ($) Total Expenditure(US$ Billions) PRC (Thousands) Expenditure perPRC ($)Baseline Optimistic Baseline Optimistic Baseline Optimistic Absolute Percent Absolute Percent Absolute PercentTotal Expenditure(US$ Billions)Expenditure per PRC($)PRC(Thousands)Chronic DiseaseDiseaseExpenditures(Billions)PRC*(Millions)Cancer 48.1 10.6 4.5Breast Cancer 5.5 1.1 4.8Colon Cancer 3.9 0.3 11.5Lung Cancer 6.3 0.4 17.1Prostate Cancer 4.3 1.0 4.1Cancer 208 4,831 1.01 307 253 8,989 8,175 2.76 2.07 -55 -17.78 -814 -9.06 -0.70 -25.22Breast cancer 23 4,871 0.11 30 26 8,967 8,154 0.27 0.21 -4 -12.30 -813 -9.07 -0.05 -20.25Colon cancer 6 11,867 0.08 7 6 23,761 21,615 0.18 0.13 -1 -17.67 -2,146 -9.03 -0.04 -25.11Lung cancer 8 16,282 0.12 9 7 30,044 27,320 0.28 0.20 -2 -18.44 -2,725 -9.07 -0.07 -25.84Prostate cancer 18 4,524 0.08 28 22 8,509 7,738 0.24 0.17 -6 -21.48 -771 -9.06 -0.07 -28.59Other cancers 154 4,085 0.63 233 191 7,753 7,051 1.81 1.35 -42 -18.00 -702 -9.06 -0.46 -25.43Diabetes 283 2,185 0.62 379 329 4,119 3,746 1.56 1.23 -50 -13.30 -373 -9.06 -0.33 -21.15Heart disease 441 3,952 1.74 538 352 7,859 7,149 4.23 2.52 -186 -34.63 -710 -9.04 -1.72 -40.53Pulmonary conditions 1,135 1,134 1.29 1,402 1,205 2,205 2,006 3.09 2.42 -197 -14.05 -200 -9.05 -0.67 -21.83Hypertension 862 869 0.75 1,073 873 1,641 1,492 1.76 1.30 -201 -18.70 -149 -9.06 -0.46 -26.06Stroke 59 5,106 0.30 67 54 10,330 9,397 0.69 0.51 -13 -18.84 -933 -9.03 -0.18 -26.17Mental disorders 624 1,625 1.01 861 755 3,040 2,765 2.62 2.09 -106 -12.35 -276 -9.06 -0.53 -20.29Total 3,612 1,863 6.73 4,628 3,820 4,114 3,742 16.72 12.13 -808 -17.46 -372 -9.05 -4.59 -27.45Indirect Impacts* (US$ Billions)TotalLost Work Days Presenteeism Lost Work Days Presenteeism Projections - Level Projections - DifferenceBaseline Optimistic Baseline Optimistic Baseline Optimistic Baseline Optimistic Baseline Optimistic Absolute Percent2023Individual Caregiver2003TotalLevelChronic DiseaseCancer 5.34 0.87 0.72 14.79 8.80 0.063 0.052 1.43 0.93 17.16 10.49 -6.67 -38.85Breast cancer 0.58 0.08 0.07 1.43 0.90 0.006 0.005 0.14 0.10 1.66 1.08 -0.58 -34.79Colon cancer 0.39 0.06 0.05 0.94 0.56 0.004 0.003 0.09 0.06 1.09 0.67 -0.42 -38.76Lung cancer 0.65 0.09 0.07 1.47 0.87 0.006 0.005 0.14 0.09 1.71 1.04 -0.67 -39.36Prostate cancer 0.42 0.08 0.06 1.28 0.73 0.005 0.004 0.12 0.08 1.49 0.87 -0.62 -41.61Other cancers 3.30 0.57 0.47 9.67 5.74 0.041 0.034 0.94 0.61 11.22 6.84 -4.38 -39.02Diabetes 2.16 0.63 0.54 5.11 4.01 0.050 0.043 0.54 0.42 6.33 5.01 -1.31 -20.76Heart disease 2.41 1.25 0.82 4.54 2.48 0.123 0.080 0.44 0.24 6.35 3.62 -2.73 -43.01Asthma 2.16 1.16 0.99 4.12 3.35 0.084 0.072 0.40 0.32 5.76 4.74 -1.02 -17.74Hypertension 6.55 2.59 2.11 13.45 10.64 0.254 0.207 1.30 1.03 17.60 13.99 -3.62 -20.55Stroke 0.54 0.22 0.18 0.98 0.74 0.016 0.013 0.10 0.07 1.31 1.00 -0.31 -23.35Emotional disturbances 3.52 1.16 1.02 8.43 7.09 0.084 0.074 0.81 0.68 10.49 8.86 -1.63 -15.54Total 22.68 7.88 6.37 51.43 37.10 0.67 0.54 5.02 3.70 65.01 47.72 -17.29 -26.60* Based on Nominal GDPExpenditures/PRC(Thousands)Intergenerational Impacts2023 2023 2050 2050Projections - Level Projections - Difference Projections - Level Projections - DifferenceOther Cancers 28.0 7.7 3.6Pulmonary Conditions 45.2 49.2 0.9Diabetes 27.1 13.7 2.0Hypertension 32.5 36.8 0.9Heart Disease 64.7 19.2 3.4Stroke 13.6 2.4 5.6Mental Disorders 45.8 30.3 1.5Total 277.0 162.2 1.7PRC: Population Reporting ConditionBaseline Optimistic Absolute PercentBaseline Optimistic Absolute Percent1970 2003VariablesBachelor's degrees (percent) 8.30 22.37 25.05 26.68 1.63 6.50 30.96 36.33 5.37 17.33Capital stock (US$ Billions) 146.24 372.06 715.67 741.72 26.05 3.64 1931.92 2119.54 187.62 9.72Life expectancy at 65 (years) 14.73 17.72 19.38 20.49 1.11 5.75 22.16 24.29 2.13 9.62GDP* by state (US$ Billions) 41.75 213.12 305.94 327.50 21.56 7.05 469.17 551.51 82.34 17.55*Based on Real GDP[ 200 ]


