

An Unhealthy America: The Economic Burden of ... - Milken Institute
An Unhealthy America: The Economic Burden of ... - Milken Institute
An Unhealthy America: The Economic Burden of ... - Milken Institute

You also want an ePaper? Increase the reach of your titles
YUMPU automatically turns print PDFs into web optimized ePapers that Google loves.
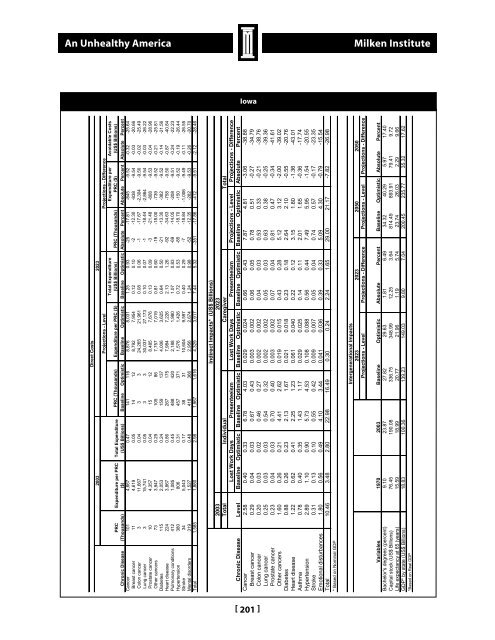
<strong>An</strong> <strong>Unhealthy</strong> <strong>America</strong><strong>Milken</strong> <strong>Institute</strong>IowaIowaDirect Costs2003 2023Projections - Level Projections - DifferenceAvoidable Costs(US$ Billions)Expenditure perPRC ($)Total Expenditure(US$ Billions) PRC (Thousands)PRC (Thousands) Expenditure per PRC ($)Baseline Optimistic Baseline Optimistic Baseline Optimistic Absolute Percent Absolute Percent Absolute PercentTotal Expenditure(US$ Billions)Expenditure per PRC($)PRC(Thousands)Chronic DiseaseDiseaseExpenditures(Billions)PRC*(Millions)Cancer 48.1 10.6 4.5Breast Cancer 5.5 1.1 4.8Colon Cancer 3.9 0.3 11.5Lung Cancer 6.3 0.4 17.1Prostate Cancer 4.3 1.0 4.1Other Cancers 28.0 7.7 3.6Pulmonary Conditions 45.2 49.2 0.9Diabetes 27.1 13.7 2.0Hypertension 32.5 36.8 0.9Heart Disease 64.7 19.2 3.4Cancer 101 4,667 0.47 141 116 8,876 8,031 1.25 0.93 -25 -17.81 -845 -9.52 -0.32 -25.64Breast cancer 11 4,619 0.05 14 12 8,792 7,954 0.12 0.10 -2 -12.30 -838 -9.54 -0.03 -20.66Colon cancer 3 11,667 0.04 3 3 24,265 21,961 0.08 0.06 -1 -17.67 -2,304 -9.50 -0.02 -25.49Lung cancer 3 15,741 0.05 3 3 30,037 27,173 0.10 0.07 -1 -18.44 -2,864 -9.54 -0.03 -26.22Prostate cancer 10 4,357 0.04 15 12 8,485 7,676 0.13 0.09 -3 -21.48 -808 -9.53 -0.04 -28.96Other cancers 73 3,947 0.29 105 86 7,757 7,019 0.81 0.60 -19 -18.00 -739 -9.52 -0.21 -25.81Diabetes 115 2,053 0.24 159 137 4,006 3,625 0.64 0.50 -21 -13.30 -382 -9.52 -0.14 -21.56Heart disease 224 3,867 0.86 267 175 7,984 7,226 2.13 1.26 -92 -34.63 -758 -9.50 -0.87 -40.84Pulmonary conditions 412 1,085 0.45 488 420 2,188 1,980 1.07 0.83 -69 -14.05 -208 -9.51 -0.24 -22.23Hypertension 380 806 0.31 457 371 1,576 1,426 0.72 0.53 -85 -18.70 -150 -9.52 -0.19 -26.44Stroke 34 5,043 0.17 38 31 10,604 9,597 0.40 0.29 -7 -18.84 -1,006 -9.49 -0.11 -26.55Mental disorders 319 1,527 0.48 418 366 2,956 2,674 1.24 0.98 -52 -12.35 -282 -9.53 -0.26 -20.70Total 1,585 1,880 2.98 1,967 1,616 4,329 3,917 7.44 5.32 -351 -17.86 -412 -9.51 -2.12 -28.46Indirect Impacts* (US$ Billions)2023Individual Caregiver TotalLost Work Days Presenteeism Lost Work Days Presenteeism Projections - Level Projections - DifferenceBaseline Optimistic Baseline Optimistic Baseline Optimistic Baseline Optimistic Baseline Optimistic Absolute Percent2003TotalLevelChronic DiseaseCancer 2.58 0.40 0.33 6.78 4.03 0.029 0.024 0.66 0.43 7.87 4.81 -3.06 -38.88Breast cancer 0.29 0.04 0.03 0.67 0.43 0.003 0.002 0.06 0.05 0.78 0.51 -0.27 -34.79Colon cancer 0.20 0.03 0.02 0.46 0.27 0.002 0.002 0.04 0.03 0.53 0.33 -0.21 -38.76Lung cancer 0.25 0.03 0.03 0.54 0.32 0.002 0.002 0.05 0.03 0.63 0.38 -0.25 -39.36Prostate cancer 0.23 0.04 0.03 0.70 0.40 0.003 0.002 0.07 0.04 0.81 0.47 -0.34 -41.61Other cancers 1.60 0.26 0.21 4.41 2.62 0.019 0.015 0.43 0.28 5.12 3.12 -2.00 -39.02Diabetes 0.88 0.26 0.23 2.13 1.67 0.021 0.018 0.23 0.18 2.64 2.10 -0.55 -20.76Heart disease 1.22 0.62 0.41 2.25 1.23 0.061 0.040 0.22 0.12 3.15 1.80 -1.36 -43.01Asthma 0.78 0.40 0.35 1.43 1.17 0.029 0.025 0.14 0.11 2.01 1.65 -0.36 -17.74Hypertension 2.89 1.10 0.90 5.73 4.53 0.108 0.088 0.56 0.44 7.49 5.95 -1.54 -20.55Stroke 0.31 0.13 0.10 0.55 0.42 0.009 0.007 0.05 0.04 0.74 0.57 -0.17 -23.35Emotional disturbances 1.80 0.56 0.49 4.10 3.44 0.041 0.036 0.39 0.33 5.09 4.30 -0.79 -15.54Total 10.46 3.48 2.80 22.98 16.49 0.30 0.24 2.24 1.65 29.00 21.17 -7.82 -26.98* Based on Nominal GDPExpenditures/PRC(Thousands)Intergenerational Impacts2023 2023 2050 2050Projections - LevelProjections - Difference Projections - Level Projections - DifferenceStroke 13.6 2.4 5.6Mental Disorders 45.8 30.3 1.5Total 277.0 162.2 1.7PRC: Population Reporting ConditionPercentBaseline Optimistic Absolute Percent Baseline Optimistic Absolute1970 2003VariablesBachelor's degrees (percent) 9.10 23.87 27.82 29.63 1.81 6.49 34.32 40.29 5.97 17.40Capital stock (US$ Billions) 76.45 190.08 336.75 348.99 12.25 3.64 814.49 893.91 79.41 9.72Life expectancy at 65 (years) 15.59 18.99 20.77 21.96 1.19 5.74 23.74 26.03 2.29 9.66GDP* by state (US$ Billions) 18.83 100.36 139.23 149.03 9.80 7.04 200.45 235.77 35.32 17.62*Based on Real GDP[ 201 ]


