Hedge funds and Private Equity - PES
Hedge funds and Private Equity - PES
Hedge funds and Private Equity - PES

You also want an ePaper? Increase the reach of your titles
YUMPU automatically turns print PDFs into web optimized ePapers that Google loves.
The international financial authorities are not offering clear answers.<br />
Anyhow, for the sake of clarity we must distinguish between taxation of the fund <strong>and</strong> taxation of<br />
the fund manager. The broad majority of <strong>funds</strong> are located outside the EU – chiefly for the reason<br />
of tax minimisation – with the consequence of tax losses for the EU region. This loss of income<br />
cannot be avoided by ensuring that managers pay the correct amount of tax for their on-shore<br />
activities.<br />
It is a complex challenge to try to enhance efforts to protect tax revenues for Europe’s welfare<br />
societies given the international character of hedge <strong>funds</strong> <strong>and</strong> private equity <strong>funds</strong>. It is not<br />
impossible – there can be a case for coordinated actions among member states. But a condition<br />
of a more efficient approach will be higher transparency <strong>and</strong> disclosure.<br />
1.10 The return to investors – better than others?<br />
The staggering growth of the hedge fund industry raises the obvious question: why are<br />
investors interested in hedge <strong>funds</strong>? The prevailing answer to this question is “financial performance”.<br />
The “strong selling point” of both hedge <strong>funds</strong> <strong>and</strong> private equity <strong>funds</strong> is that they appear<br />
to offer the opportunity of superior investment returns (when compared to ‘conventional’ asset<br />
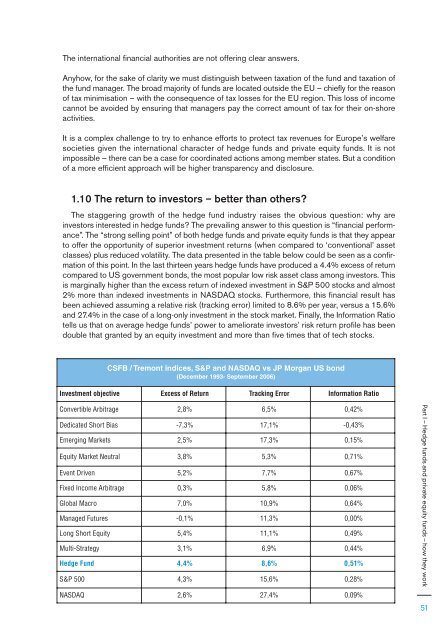
classes) plus reduced volatility. The data presented in the table below could be seen as a confirmation<br />
of this point. In the last thirteen years hedge <strong>funds</strong> have produced a 4.4% excess of return<br />
compared to US government bonds, the most popular low risk asset class among investors. This<br />
is marginally higher than the excess return of indexed investment in S&P 500 stocks <strong>and</strong> almost<br />
2% more than indexed investments in NASDAQ stocks. Furthermore, this financial result has<br />
been achieved assuming a relative risk (tracking error) limited to 8.6% per year, versus a 15.6%<br />
<strong>and</strong> 27.4% in the case of a long-only investment in the stock market. Finally, the Information Ratio<br />
tells us that on average hedge <strong>funds</strong>’ power to ameliorate investors’ risk return profile has been<br />
double that granted by an equity investment <strong>and</strong> more than five times that of tech stocks.<br />
CSFB / Tremont indices, S&P <strong>and</strong> NASDAQ vs JP Morgan US bond<br />
(December 1993- September 2006)<br />
Investment objective Excess of Return Tracking Error Information Ratio<br />
Convertible Arbitrage 2,8% 6,5% 0,42%<br />
Dedicated Short Bias -7,3% 17,1% -0,43%<br />
Emerging Markets 2,5% 17,3% 0,15%<br />
<strong>Equity</strong> Market Neutral 3,8% 5,3% 0,71%<br />
Event Driven 5,2% 7,7% 0,67%<br />
Fixed Income Arbitrage 0,3% 5,8% 0,06%<br />
Global Macro 7,0% 10,9% 0,64%<br />
Managed Futures -0,1% 11,3% 0,00%<br />
Long Short <strong>Equity</strong> 5,4% 11,1% 0,49%<br />
Multi-Strategy 3,1% 6,9% 0,44%<br />
<strong>Hedge</strong> Fund 4,4% 8,6% 0,51%<br />
S&P 500 4,3% 15,6% 0,28%<br />
NASDAQ 2,6% 27,4% 0,09%<br />
Part I – <strong>Hedge</strong> <strong>funds</strong> <strong>and</strong> private equity <strong>funds</strong> – how they work<br />
51