- Page 2 and 3:
20120618
- Page 4 and 5:
Table of ContentsTable of Contents(
- Page 6 and 7:
List of TablesList of Tables(contin
- Page 8 and 9:
List of TablesThis page intentional
- Page 10 and 11:
List of FiguresList of Figures(cont
- Page 12 and 13:
List of FiguresList of Figures(cont
- Page 14 and 15:
AcknowledgementsThis page intention
- Page 16 and 17:
Executive Summarymobility options a
- Page 18 and 19:
Executive SummaryTable ES.1 Mobilit
- Page 20 and 21:
Executive SummaryRecommendations fo
- Page 22 and 23:
Executive SummaryThis page intentio
- Page 24 and 25:
Introduction(HOV) policies, high-oc
- Page 26 and 27:
Introduction1.3 Overview of Work Pr
- Page 28 and 29:
IntroductionStudy WebpageThe I-66 M
- Page 30 and 31:
IntroductionThis page intentionally
- Page 32 and 33:
Mobility OptionsFigure 2.1Issues an
- Page 34 and 35:
Mobility OptionsKeeps mobility opti
- Page 36 and 37:
Mobility Optionsanticipated to have
- Page 38 and 39:
Mobility OptionsTable 2.2 Mobility
- Page 40 and 41:
Mobility OptionsFigure 2.2Abbreviat
- Page 42 and 43:
Mobility OptionsFigure 2.3Cutline L
- Page 44 and 45:
Mobility OptionsFigure 2.4Peak-Hour
- Page 46 and 47:
Mobility OptionsTotal VMT in the st
- Page 48 and 49:
Mobility OptionsThere is some shift
- Page 50 and 51: Mobility OptionsThe percentage of t
- Page 52 and 53: Mobility OptionsMode share shows no
- Page 54 and 55: Mobility OptionsFigure 2.15 Morning
- Page 56 and 57: Mobility OptionsKey FindingsThis op
- Page 58 and 59: Mobility OptionsFigure 2.17 Interli
- Page 60 and 61: Mobility Options2. Orange Line Bypa
- Page 62 and 63: Mobility OptionsAs travelers make u
- Page 64 and 65: Mobility OptionsTable 2.3 Mobility
- Page 66 and 67: Mobility OptionsThis page intention
- Page 68 and 69: Multimodal PackagesReducing the pro
- Page 70 and 71: Multimodal PackagesTable 3.2 Recomm
- Page 72 and 73: Multimodal PackagesFigure 3.1Travel
- Page 74 and 75: Multimodal PackagesTransit Accessib
- Page 76 and 77: Multimodal PackagesTransportation R
- Page 78 and 79: Multimodal PackagesTable 3.4 CLRP a
- Page 80 and 81: Multimodal PackagesMeasures of Effe
- Page 82 and 83: Multimodal PackagesLevel of Service
- Page 84 and 85: Multimodal PackagesFigure 3.6 CLRP+
- Page 86 and 87: Multimodal PackagesFigure 3.8 CLRP+
- Page 88 and 89: Multimodal Packages3.4 Package 1 -
- Page 90 and 91: Multimodal PackagesFigure 3.12 Pack
- Page 92 and 93: Multimodal PackagesTable 3.5 Packag
- Page 94 and 95: Multimodal PackagesFigure 3.15 Pack
- Page 96 and 97: Multimodal PackagesFigure 3.17 Pack
- Page 98 and 99: Multimodal PackagesThe tolls would
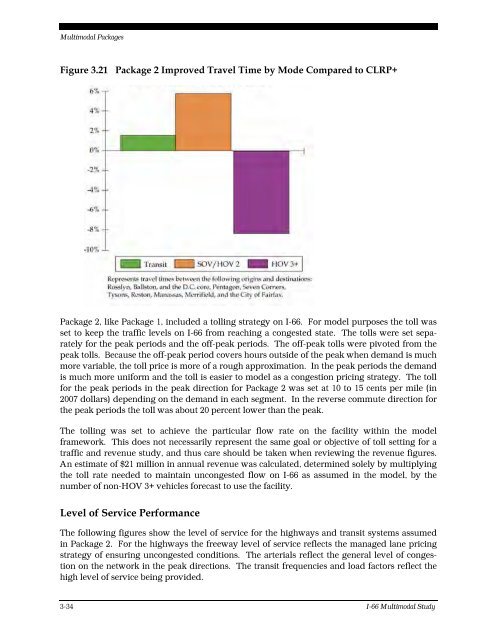
- Page 102 and 103: Multimodal PackagesFigure 3.22 Pack
- Page 104 and 105: Multimodal PackagesFigure 3.24 Pack
- Page 106 and 107: Multimodal PackagesCost EstimatesPa
- Page 108 and 109: Multimodal PackagesThis package sho
- Page 110 and 111: Multimodal PackagesLevel of Service
- Page 112 and 113: Multimodal PackagesFigure 3.31 Pack
- Page 114 and 115: Multimodal PackagesFigure 3.33 Pack
- Page 116 and 117: Multimodal Packagesminute limit was
- Page 118 and 119: Multimodal PackagesFigure 3.35 Pack
- Page 120 and 121: Multimodal PackagesTable 3.12Packag
- Page 122 and 123: Multimodal PackagesFigure 3.38 Pack
- Page 124 and 125: Multimodal PackagesFigure 3.40 Pack
- Page 126 and 127: Multimodal PackagesMultimodal Trave
- Page 128 and 129: Multimodal Packagesemerging focus a
- Page 130 and 131: Multimodal PackagesDynamic Merge (J
- Page 132 and 133: Multimodal PackagesImproved network
- Page 134 and 135: Multimodal PackagesMarketing and Ou
- Page 136 and 137: Multimodal Packagesround trip usage
- Page 138 and 139: Multimodal PackagesTable 3.16 Annua
- Page 140 and 141: Multimodal PackagesTable 3.19 TDM 2
- Page 142 and 143: Multimodal PackagesTable 3.20 Map K
- Page 144 and 145: Multimodal PackagesTable 3.20 Map K
- Page 146 and 147: Multimodal PackagesFigure 3.43 Bicy
- Page 148 and 149: Multimodal PackagesFigure 3.44 2040
- Page 150 and 151:
Multimodal PackagesPrioritization o
- Page 152 and 153:
Multimodal PackagesTable 3.21 2040
- Page 154 and 155:
Multimodal PackagesCost EstimatesPl
- Page 156 and 157:
Multimodal PackagesProject lengths
- Page 158 and 159:
Multimodal PackagesTable 3.24Priori
- Page 160 and 161:
Multimodal PackagesFigure 3.46 Map
- Page 162 and 163:
Multimodal PackagesTable 3.25 Bicyc
- Page 164 and 165:
Multimodal PackagesTable 3.26Measur
- Page 166 and 167:
Multimodal PackagesTable 3.26Measur
- Page 168 and 169:
Multimodal Packagessensitivity test
- Page 170 and 171:
Multimodal PackagesTable 3.27 Sensi
- Page 172 and 173:
Recommendationswill be prudent to p
- Page 174 and 175:
Recommendationscapacity expansion w
- Page 176 and 177:
Recommendations(ROW) acquisition, w
- Page 178 and 179:
Recommendationsachieve the objectiv
- Page 180 and 181:
Recommendationsto improve mobility
- Page 182 and 183:
RecommendationsTable 4.1 Multimodal
- Page 184 and 185:
RecommendationsTable 4.2 Multimodal
- Page 186 and 187:
RecommendationsTable 4.2 Multimodal
- Page 188 and 189:
RecommendationsFigure 4.1 Map of Bi
- Page 190 and 191:
RecommendationsTable 4.3 Bicycle Pr
- Page 192 and 193:
Recommendationsand TDM. ICM brings
- Page 194 and 195:
Potential Funding ApproachesFigure
- Page 196 and 197:
Potential Funding ApproachesTable 5
- Page 198 and 199:
Potential Funding ApproachesTable 5
- Page 200 and 201:
Potential Funding Approacheslong-te
- Page 202 and 203:
Potential Funding ApproachesTable 5
- Page 204:
Potential Funding ApproachesThis pa


