

I-66 Multimodal Study Final Report - Virginia Department of ...
I-66 Multimodal Study Final Report - Virginia Department of ...
I-66 Multimodal Study Final Report - Virginia Department of ...
- No tags were found...

Create successful ePaper yourself
Turn your PDF publications into a flip-book with our unique Google optimized e-Paper software.
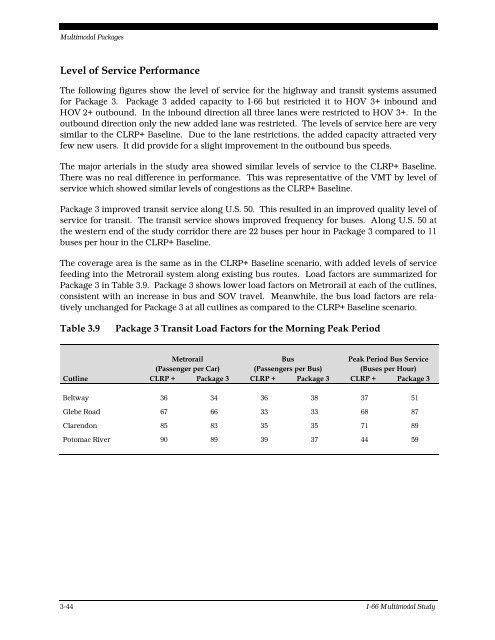
<strong>Multimodal</strong> PackagesLevel <strong>of</strong> Service PerformanceThe following figures show the level <strong>of</strong> service for the highway and transit systems assumedfor Package 3. Package 3 added capacity to I-<strong>66</strong> but restricted it to HOV 3+ inbound andHOV 2+ outbound. In the inbound direction all three lanes were restricted to HOV 3+. In theoutbound direction only the new added lane was restricted. The levels <strong>of</strong> service here are verysimilar to the CLRP+ Baseline. Due to the lane restrictions, the added capacity attracted veryfew new users. It did provide for a slight improvement in the outbound bus speeds.The major arterials in the study area showed similar levels <strong>of</strong> service to the CLRP+ Baseline.There was no real difference in performance. This was representative <strong>of</strong> the VMT by level <strong>of</strong>service which showed similar levels <strong>of</strong> congestions as the CLRP+ Baseline.Package 3 improved transit service along U.S. 50. This resulted in an improved quality level <strong>of</strong>service for transit. The transit service shows improved frequency for buses. Along U.S. 50 atthe western end <strong>of</strong> the study corridor there are 22 buses per hour in Package 3 compared to 11buses per hour in the CLRP+ Baseline.The coverage area is the same as in the CLRP+ Baseline scenario, with added levels <strong>of</strong> servicefeeding into the Metrorail system along existing bus routes. Load factors are summarized forPackage 3 in Table 3.9. Package 3 shows lower load factors on Metrorail at each <strong>of</strong> the cutlines,consistent with an increase in bus and SOV travel. Meanwhile, the bus load factors are relativelyunchanged for Package 3 at all cutlines as compared to the CLRP+ Baseline scenario.Table 3.9Package 3 Transit Load Factors for the Morning Peak PeriodMetrorail Bus Peak Period Bus Service(Passenger per Car) (Passengers per Bus) (Buses per Hour)Cutline CLRP + Package 3 CLRP + Package 3 CLRP + Package 3Beltway 36 34 36 38 37 51Glebe Road 67 <strong>66</strong> 33 33 68 87Clarendon 85 83 35 35 71 89Potomac River 90 89 39 37 44 593-44 I-<strong>66</strong> <strong>Multimodal</strong> <strong>Study</strong>


