

I-66 Multimodal Study Final Report - Virginia Department of ...
I-66 Multimodal Study Final Report - Virginia Department of ...
I-66 Multimodal Study Final Report - Virginia Department of ...
- No tags were found...

Create successful ePaper yourself
Turn your PDF publications into a flip-book with our unique Google optimized e-Paper software.
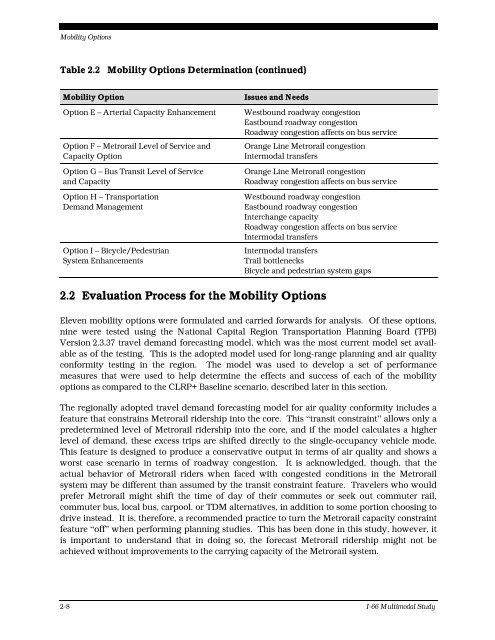
Mobility OptionsTable 2.2 Mobility Options Determination (continued)Mobility OptionOption E – Arterial Capacity EnhancementOption F – Metrorail Level <strong>of</strong> Service andCapacity OptionOption G – Bus Transit Level <strong>of</strong> Serviceand CapacityOption H – TransportationDemand ManagementOption I – Bicycle/PedestrianSystem EnhancementsIssues and NeedsWestbound roadway congestionEastbound roadway congestionRoadway congestion affects on bus serviceOrange Line Metrorail congestionIntermodal transfersOrange Line Metrorail congestionRoadway congestion affects on bus serviceWestbound roadway congestionEastbound roadway congestionInterchange capacityRoadway congestion affects on bus serviceIntermodal transfersIntermodal transfersTrail bottlenecksBicycle and pedestrian system gaps2.2 Evaluation Process for the Mobility OptionsEleven mobility options were formulated and carried forwards for analysis. Of these options,nine were tested using the National Capital Region Transportation Planning Board (TPB)Version 2.3.37 travel demand forecasting model, which was the most current model set availableas <strong>of</strong> the testing. This is the adopted model used for long-range planning and air qualityconformity testing in the region. The model was used to develop a set <strong>of</strong> performancemeasures that were used to help determine the effects and success <strong>of</strong> each <strong>of</strong> the mobilityoptions as compared to the CLRP+ Baseline scenario, described later in this section.The regionally adopted travel demand forecasting model for air quality conformity includes afeature that constrains Metrorail ridership into the core. This “transit constraint” allows only apredetermined level <strong>of</strong> Metrorail ridership into the core, and if the model calculates a higherlevel <strong>of</strong> demand, these excess trips are shifted directly to the single-occupancy vehicle mode.This feature is designed to produce a conservative output in terms <strong>of</strong> air quality and shows aworst case scenario in terms <strong>of</strong> roadway congestion. It is acknowledged, though, that theactual behavior <strong>of</strong> Metrorail riders when faced with congested conditions in the Metrorailsystem may be different than assumed by the transit constraint feature. Travelers who wouldprefer Metrorail might shift the time <strong>of</strong> day <strong>of</strong> their commutes or seek out commuter rail,commuter bus, local bus, carpool, or TDM alternatives, in addition to some portion choosing todrive instead. It is, therefore, a recommended practice to turn the Metrorail capacity constraintfeature “<strong>of</strong>f” when performing planning studies. This has been done in this study, however, itis important to understand that in doing so, the forecast Metrorail ridership might not beachieved without improvements to the carrying capacity <strong>of</strong> the Metrorail system.2-8 I-<strong>66</strong> <strong>Multimodal</strong> <strong>Study</strong>


