A Greater Australia: Population, policies and governance - CEDA
A Greater Australia: Population, policies and governance - CEDA
A Greater Australia: Population, policies and governance - CEDA
- No tags were found...

Create successful ePaper yourself
Turn your PDF publications into a flip-book with our unique Google optimized e-Paper software.
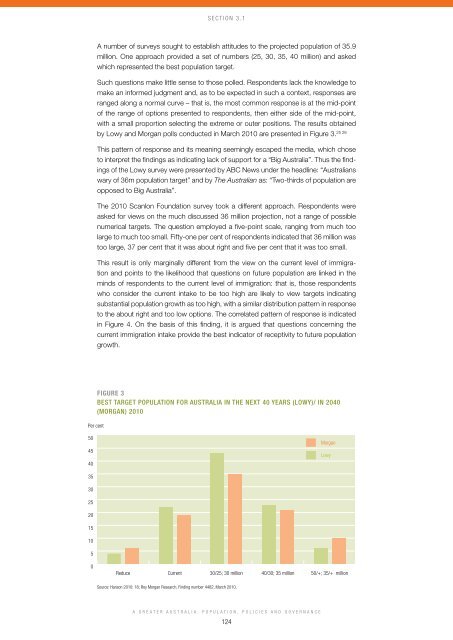
Section 3.1A number of surveys sought to establish attitudes to the projected population of 35.9million. One approach provided a set of numbers (25, 30, 35, 40 million) <strong>and</strong> askedwhich represented the best population target.Such questions make little sense to those polled. Respondents lack the knowledge tomake an informed judgment <strong>and</strong>, as to be expected in such a context, responses areranged along a normal curve – that is, the most common response is at the mid-pointof the range of options presented to respondents, then either side of the mid-point,with a small proportion selecting the extreme or outer positions. The results obtained25 26by Lowy <strong>and</strong> Morgan polls conducted in March 2010 are presented in Figure 3.This pattern of response <strong>and</strong> its meaning seemingly escaped the media, which choseto interpret the findings as indicating lack of support for a “Big <strong>Australia</strong>”. Thus the findingsof the Lowy survey were presented by ABC News under the headline: “<strong>Australia</strong>nswary of 36m population target” <strong>and</strong> by The <strong>Australia</strong>n as: “Two-thirds of population areopposed to Big <strong>Australia</strong>”.The 2010 Scanlon Foundation survey took a different approach. Respondents wereasked for views on the much discussed 36 million projection, not a range of possiblenumerical targets. The question employed a five-point scale, ranging from much toolarge to much too small. Fifty-one per cent of respondents indicated that 36 million wastoo large, 37 per cent that it was about right <strong>and</strong> five per cent that it was too small.This result is only marginally different from the view on the current level of immigration<strong>and</strong> points to the likelihood that questions on future population are linked in theminds of respondents to the current level of immigration: that is, those respondentswho consider the current intake to be too high are likely to view targets indicatingsubstantial population growth as too high, with a similar distribution pattern in responseto the about right <strong>and</strong> too low options. The correlated pattern of response is indicatedin Figure 4. On the basis of this finding, it is argued that questions concerning thecurrent immigration intake provide the best indicator of receptivity to future populationgrowth.Figure 3Best target population for <strong>Australia</strong> in the next 40 years (Lowy)/ in 2040(Morgan) 2010Per cent504540MorganLowy35302520151050ReduceCurrent30/25; 30 million40/30; 35 million50/+; 35/+ millionSource: Hanson 2010: 18; Roy Morgan Research, Finding number 4482, March 2010.A <strong>Greater</strong> <strong>Australia</strong>: <strong>Population</strong>, Policies <strong>and</strong> Governance124