A Greater Australia: Population, policies and governance - CEDA
A Greater Australia: Population, policies and governance - CEDA
A Greater Australia: Population, policies and governance - CEDA
- No tags were found...
Create successful ePaper yourself
Turn your PDF publications into a flip-book with our unique Google optimized e-Paper software.
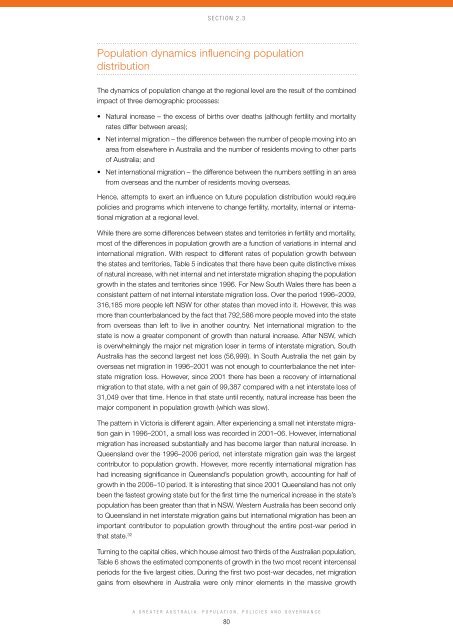
Section 2.3<strong>Population</strong> dynamics influencing populationdistributionThe dynamics of population change at the regional level are the result of the combinedimpact of three demographic processes:• Natural increase – the excess of births over deaths (although fertility <strong>and</strong> mortalityrates differ between areas);• Net internal migration – the difference between the number of people moving into anarea from elsewhere in <strong>Australia</strong> <strong>and</strong> the number of residents moving to other partsof <strong>Australia</strong>; <strong>and</strong>• Net international migration – the difference between the numbers settling in an areafrom overseas <strong>and</strong> the number of residents moving overseas.Hence, attempts to exert an influence on future population distribution would require<strong>policies</strong> <strong>and</strong> programs which intervene to change fertility, mortality, internal or internationalmigration at a regional level.While there are some differences between states <strong>and</strong> territories in fertility <strong>and</strong> mortality,most of the differences in population growth are a function of variations in internal <strong>and</strong>international migration. With respect to different rates of population growth betweenthe states <strong>and</strong> territories, Table 5 indicates that there have been quite distinctive mixesof natural increase, with net internal <strong>and</strong> net interstate migration shaping the populationgrowth in the states <strong>and</strong> territories since 1996. For New South Wales there has been aconsistent pattern of net internal interstate migration loss. Over the period 1996–2009,316,185 more people left NSW for other states than moved into it. However, this wasmore than counterbalanced by the fact that 792,586 more people moved into the statefrom overseas than left to live in another country. Net international migration to thestate is now a greater component of growth than natural increase. After NSW, whichis overwhelmingly the major net migration loser in terms of interstate migration, South<strong>Australia</strong> has the second largest net loss (56,999). In South <strong>Australia</strong> the net gain byoverseas net migration in 1996–2001 was not enough to counterbalance the net interstatemigration loss. However, since 2001 there has been a recovery of internationalmigration to that state, with a net gain of 99,387 compared with a net interstate loss of31,049 over that time. Hence in that state until recently, natural increase has been themajor component in population growth (which was slow).The pattern in Victoria is different again. After experiencing a small net interstate migrationgain in 1996–2001, a small loss was recorded in 2001–06. However, internationalmigration has increased substantially <strong>and</strong> has become larger than natural increase. InQueensl<strong>and</strong> over the 1996–2006 period, net interstate migration gain was the largestcontributor to population growth. However, more recently international migration hashad increasing significance in Queensl<strong>and</strong>’s population growth, accounting for half ofgrowth in the 2006–10 period. It is interesting that since 2001 Queensl<strong>and</strong> has not onlybeen the fastest growing state but for the first time the numerical increase in the state’spopulation has been greater than that in NSW. Western <strong>Australia</strong> has been second onlyto Queensl<strong>and</strong> in net interstate migration gains but international migration has been animportant contributor to population growth throughout the entire post-war period inthat state. 32Turning to the capital cities, which house almost two thirds of the <strong>Australia</strong>n population,Table 6 shows the estimated components of growth in the two most recent intercensalperiods for the five largest cities. During the first two post-war decades, net migrationgains from elsewhere in <strong>Australia</strong> were only minor elements in the massive growthA <strong>Greater</strong> <strong>Australia</strong>: <strong>Population</strong>, Policies <strong>and</strong> Governance80


