A Greater Australia: Population, policies and governance - CEDA
A Greater Australia: Population, policies and governance - CEDA
A Greater Australia: Population, policies and governance - CEDA
- No tags were found...

You also want an ePaper? Increase the reach of your titles
YUMPU automatically turns print PDFs into web optimized ePapers that Google loves.
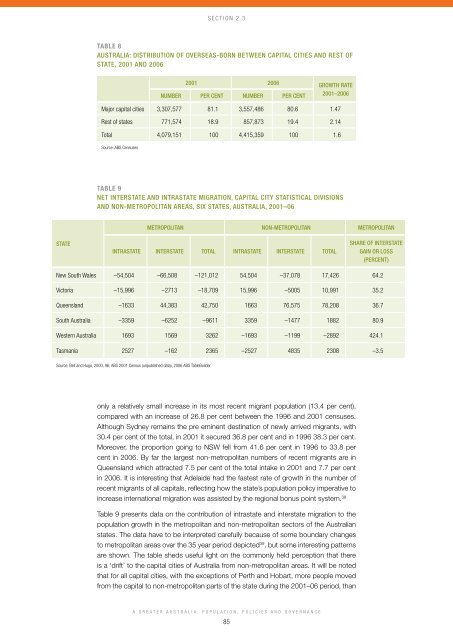
Section 2.3Table 8<strong>Australia</strong>: Distribution of Overseas-Born Between Capital Cities <strong>and</strong> Rest ofState, 2001 <strong>and</strong> 20062001 2006 Growth rate2001–2006Number Per cent Number Per centMajor capital cities 3,307,577 81.1 3,557,486 80.6 1.47Rest of states 771,574 18.9 857,873 19.4 2.14Total 4,079,151 100 4,415,359 100 1.6Source: ABS CensusesTable 9Net Interstate <strong>and</strong> Intrastate Migration, Capital City Statistical Divisions<strong>and</strong> Non-Metropolitan Areas, Six States, <strong>Australia</strong>, 2001–06Metropolitan Non-Metropolitan MetropolitanStateIntrastate Interstate Total Intrastate Interstate TotalShare of InterstateGain or Loss(Percent)New South Wales –54,504 –66,508 –121,012 54,504 –37,078 17,426 64.2Victoria –15,996 –2713 –18,709 15,996 –5005 10,991 35.2Queensl<strong>and</strong> –1633 44,383 42,750 1663 76,575 78,208 36.7South <strong>Australia</strong> –3359 –6252 –9611 3359 –1477 1882 80.9Western <strong>Australia</strong> 1693 1569 3262 –1693 –1199 –2892 424.1Tasmania 2527 –162 2365 –2527 4835 2308 –3.5Source: Bell <strong>and</strong> Hugo, 2000, 96; ABS 2001 Census (unpublished data), 2006 ABS TableBuilderonly a relatively small increase in its most recent migrant population (13.4 per cent),compared with an increase of 26.8 per cent between the 1996 <strong>and</strong> 2001 censuses.Although Sydney remains the pre eminent destination of newly arrived migrants, with30.4 per cent of the total, in 2001 it secured 36.8 per cent <strong>and</strong> in 1996 38.3 per cent.Moreover, the proportion going to NSW fell from 41.6 per cent in 1996 to 33.8 percent in 2006. By far the largest non-metropolitan numbers of recent migrants are inQueensl<strong>and</strong> which attracted 7.5 per cent of the total intake in 2001 <strong>and</strong> 7.7 per centin 2006. It is interesting that Adelaide had the fastest rate of growth in the number ofrecent migrants of all capitals, reflecting how the state’s population policy imperative toincrease international migration was assisted by the regional bonus point system. 38Table 9 presents data on the contribution of intrastate <strong>and</strong> interstate migration to thepopulation growth in the metropolitan <strong>and</strong> non-metropolitan sectors of the <strong>Australia</strong>nstates. The data have to be interpreted carefully because of some boundary changesto metropolitan areas over the 35 year period depicted 39 , but some interesting patternsare shown. The table sheds useful light on the commonly held perception that thereis a ‘drift’ to the capital cities of <strong>Australia</strong> from non-metropolitan areas. It will be notedthat for all capital cities, with the exceptions of Perth <strong>and</strong> Hobart, more people movedfrom the capital to non-metropolitan parts of the state during the 2001–06 period, thanA <strong>Greater</strong> <strong>Australia</strong>: <strong>Population</strong>, Policies <strong>and</strong> Governance85