- Page 2 and 3:
A Greater Australia:Population, pol
- Page 4 and 5:
ContentsForeword CEDA Chief Executi
- Page 6 and 7:
ForewordIt is with pleasure that I
- Page 8 and 9:
IntroductionResponding to the resul
- Page 10 and 11:
IntroductionA more dynamic and vita
- Page 12 and 13:
IntroductionSustainabilityConcern a
- Page 14 and 15:
IntroductionThe new demographics, h
- Page 16 and 17:
Section 1.0Historical perspectives1
- Page 18 and 19:
Section 1.1IntroductionJapan’s cr
- Page 20 and 21:
Section 1.1Figure 1Forecast number
- Page 22 and 23:
Section 1.1Table 1Defence spending
- Page 24 and 25:
Section 1.1How much defence is enou
- Page 26 and 27: Section 1.1ConclusionA substantial
- Page 28 and 29: Section 1.2There has been over a ce
- Page 30 and 31: Section 1.2Resource constraints wer
- Page 32 and 33: Section 1.2Similarly, in the 1994 H
- Page 34 and 35: Section 1.2ReferencesAustralia, Dep
- Page 36 and 37: Section 1.3IntroductionAustralia is
- Page 38 and 39: Section 1.3The grey 90sThe heady ex
- Page 40 and 41: Section 1.3Taylor’s stony rebutta
- Page 42 and 43: Section 1.3Figure 1The Benhamite Op
- Page 44 and 45: Section 1.3In mathematical terms, t
- Page 46 and 47: Section 1.3characterisation of the
- Page 48 and 49: Section 1.3ConclusionA retrospectiv
- Page 50 and 51: Section 2.0Population futures2.1 Fo
- Page 52 and 53: Section 2.1Conventional population
- Page 54 and 55: Section 2.1It is more useful for go
- Page 56 and 57: Section 2.1Forecasting of births, w
- Page 58 and 59: Section 2.1Future net overseas migr
- Page 60 and 61: Section 2.13). This had a lot to do
- Page 62 and 63: Section 2.2IntroductionIn late Sept
- Page 64 and 65: Section 2.2Figure 1The migrant cont
- Page 66 and 67: Section 2.2The visa and residency s
- Page 68 and 69: Section 2.2sponsorship, subject to
- Page 70 and 71: Section 2.2Figure 3Historical and p
- Page 72 and 73: Section 2.2The views in this chapte
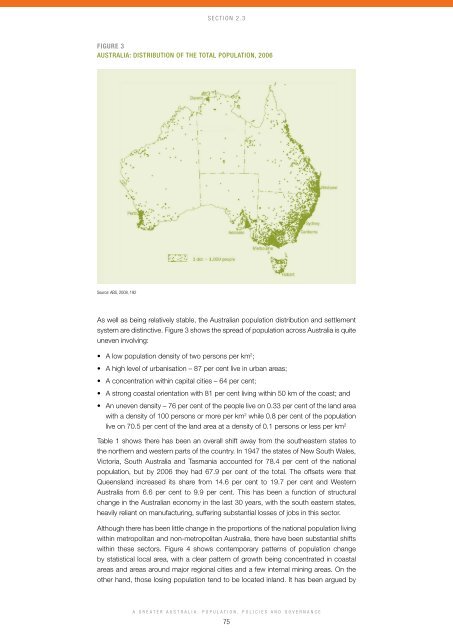
- Page 74 and 75: Section 2.3IntroductionThe Australi
- Page 78 and 79: Section 2.3Table 2Australia: Popula
- Page 80 and 81: Section 2.3Table 4Views of Australi
- Page 82 and 83: Section 2.3Table 5Australian States
- Page 84 and 85: Section 2.3A number of hypotheses h
- Page 86 and 87: Section 2.3Table 8Australia: Distri
- Page 88 and 89: Section 2.3Table 10Non-Metropolitan
- Page 90 and 91: Section 2.3Policy issuesThe configu
- Page 92 and 93: Section 2.3Climate change is likely
- Page 94 and 95: Section 2.3ConclusionAny realistic
- Page 96 and 97: Section 2.340 Swan, W., 2010.Austra
- Page 98 and 99: Section 2.4IntroductionThe Australi
- Page 100 and 101: Section 2.4At present there is a hi
- Page 102 and 103: Section 2.4innovation initiatives w
- Page 104 and 105: Section 2.4Endnotes1 Henry, K 2009,
- Page 106 and 107: Section 2.5IntroductionAustralia is
- Page 108 and 109: Section 2.5else. Even with a broad
- Page 110 and 111: Section 2.5commercially viable - th
- Page 112 and 113: Section 2.5A vast country like Aust
- Page 114 and 115: Section 3.0Society and the individu
- Page 116 and 117: Section 3.1Extent of public opinion
- Page 119 and 120: Section 3.1category immigrant/forei
- Page 121 and 122: Section 3.1The Environics Research
- Page 123 and 124: Section 3.1Per cent100908070Figure
- Page 125 and 126: Section 3.1A number of surveys soug
- Page 127 and 128:
Section 3.1Table 8Percentage who an
- Page 129 and 130:
Section 3.1A more precise indicatio
- Page 131 and 132:
Section 3.1The strongest predictor
- Page 133 and 134:
Section 3.1Endnotes1. There is also
- Page 135 and 136:
3.2Social inclusion and multicultur
- Page 137 and 138:
Section 3.2a broader definition of
- Page 139 and 140:
Section 3.2Figure 1Estimated povert
- Page 141 and 142:
Section 3.2Table 2Visa Type of Sett
- Page 143 and 144:
Section 3.2Table 5First Generation
- Page 145 and 146:
Section 3.2Table 6Australia: First
- Page 147 and 148:
Section 3.2Improving outcomes for v
- Page 149 and 150:
Section 3.2increasing diversity of
- Page 151 and 152:
3.3Linkages between education and p
- Page 153 and 154:
Section 3.3Education and productivi
- Page 155 and 156:
Section 3.3In the past decade, prod
- Page 157 and 158:
Section 3.3succeed in education or
- Page 159 and 160:
Section 3.3case, funding also could
- Page 161 and 162:
Section 3.3Endnotes1 IGR 2010: Chal
- Page 163 and 164:
3.4Healthcare delivery for our agei
- Page 165 and 166:
Section 3.4• Private medical serv
- Page 167 and 168:
Section 3.4the whole spectrum of in
- Page 169 and 170:
Section 3.45. Experiences, pathways
- Page 171 and 172:
Section 3.4Stratification of patien
- Page 173 and 174:
Section 3.4Other steps include impr
- Page 175 and 176:
Section 3.438 National Health Refor
- Page 177 and 178:
4.1The economic effects ofpopulatio
- Page 179 and 180:
Section 4.1population growth can ex
- Page 181 and 182:
Section 4.1In theory, the answer pa
- Page 183 and 184:
Section 4.1Kirchner concedes that t
- Page 185 and 186:
Section 4.1Endnotes1. Productivity
- Page 187 and 188:
4.2Urban infrastructure and land us
- Page 189 and 190:
Section 4.2bearing the fixed costs
- Page 191 and 192:
Section 4.2Figure 1Indicative dwell
- Page 193 and 194:
Section 4.2Taking the electricity,
- Page 195 and 196:
Section 4.2Promoting better land us
- Page 197 and 198:
Section 4.2preferences to homeowner
- Page 199 and 200:
Section 4.2in any Australian urban
- Page 201 and 202:
Section 4.2Endnotes1 Productivity C
- Page 203 and 204:
4.3Water security:Water for the far
- Page 205 and 206:
Section 4.3Water trading enables us
- Page 207 and 208:
Section 4.3cent of water entitlemen
- Page 209 and 210:
Section 4.3were either the full eco
- Page 211 and 212:
Section 4.3Strategic opportunitiesA
- Page 213 and 214:
4.4Critiquing governmentregional de
- Page 215 and 216:
Section 4.4However, there is often
- Page 217 and 218:
Section 4.4Potential policy interve
- Page 219 and 220:
Section 4.4Unfortunately, advocacy
- Page 221 and 222:
Section 4.4contribute substantially
- Page 223 and 224:
Section 4.418 Department of Educati
- Page 225 and 226:
5.1The future of population policyG
- Page 227 and 228:
Section 5.1a million fewer women in
- Page 229 and 230:
Section 5.1For the present, ongoing
- Page 231 and 232:
Section 5.1The second worry is that
- Page 233 and 234:
Section 5.1The now significantly de