A Greater Australia: Population, policies and governance - CEDA
A Greater Australia: Population, policies and governance - CEDA
A Greater Australia: Population, policies and governance - CEDA
- No tags were found...

You also want an ePaper? Increase the reach of your titles
YUMPU automatically turns print PDFs into web optimized ePapers that Google loves.
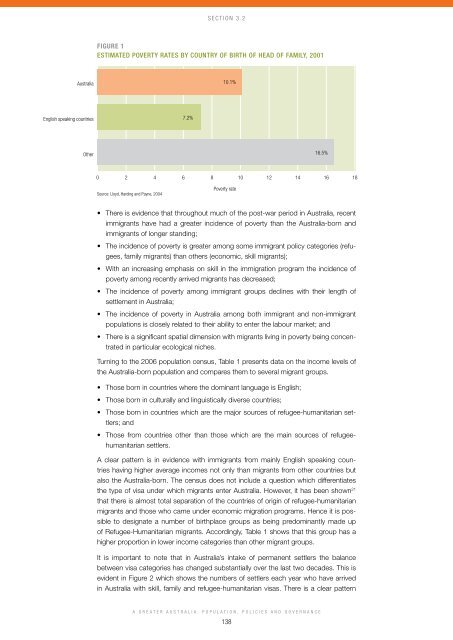
Section 3.2Figure 1Estimated poverty rates by country of birth of head of family, 2001<strong>Australia</strong>10.1%English speaking countries7.2%Other16.5%0 2 4 6 8 10 12 14 16 18Source: Lloyd, Harding <strong>and</strong> Payne, 2004Poverty rate• There is evidence that throughout much of the post-war period in <strong>Australia</strong>, recentimmigrants have had a greater incidence of poverty than the <strong>Australia</strong>-born <strong>and</strong>immigrants of longer st<strong>and</strong>ing;• The incidence of poverty is greater among some immigrant policy categories (refugees,family migrants) than others (economic, skill migrants);• With an increasing emphasis on skill in the immigration program the incidence ofpoverty among recently arrived migrants has decreased;• The incidence of poverty among immigrant groups declines with their length ofsettlement in <strong>Australia</strong>;• The incidence of poverty in <strong>Australia</strong> among both immigrant <strong>and</strong> non-immigrantpopulations is closely related to their ability to enter the labour market; <strong>and</strong>• There is a significant spatial dimension with migrants living in poverty being concentratedin particular ecological niches.Turning to the 2006 population census, Table 1 presents data on the income levels ofthe <strong>Australia</strong>-born population <strong>and</strong> compares them to several migrant groups.• Those born in countries where the dominant language is English;• Those born in culturally <strong>and</strong> linguistically diverse countries;• Those born in countries which are the major sources of refugee-humanitarian settlers;<strong>and</strong>• Those from countries other than those which are the main sources of refugeehumanitariansettlers.A clear pattern is in evidence with immigrants from mainly English speaking countrieshaving higher average incomes not only than migrants from other countries butalso the <strong>Australia</strong>-born. The census does not include a question which differentiatesthe type of visa under which migrants enter <strong>Australia</strong>. However, it has been shown 21that there is almost total separation of the countries of origin of refugee-humanitarianmigrants <strong>and</strong> those who came under economic migration programs. Hence it is possibleto designate a number of birthplace groups as being predominantly made upof Refugee-Humanitarian migrants. Accordingly, Table 1 shows that this group has ahigher proportion in lower income categories than other migrant groups.It is important to note that in <strong>Australia</strong>’s intake of permanent settlers the balancebetween visa categories has changed substantially over the last two decades. This isevident in Figure 2 which shows the numbers of settlers each year who have arrivedin <strong>Australia</strong> with skill, family <strong>and</strong> refugee-humanitarian visas. There is a clear patternA <strong>Greater</strong> <strong>Australia</strong>: <strong>Population</strong>, Policies <strong>and</strong> Governance138