A Greater Australia: Population, policies and governance - CEDA
A Greater Australia: Population, policies and governance - CEDA
A Greater Australia: Population, policies and governance - CEDA
- No tags were found...

You also want an ePaper? Increase the reach of your titles
YUMPU automatically turns print PDFs into web optimized ePapers that Google loves.
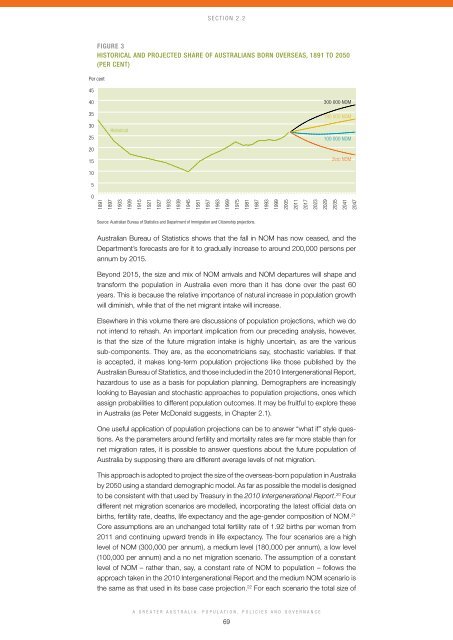
Section 2.2Figure 3Historical <strong>and</strong> projected share of <strong>Australia</strong>ns born overseas, 1891 to 2050(per cent)Per cent45403530252015105Historical300 000 NOM180 000 NOM100 000 NOMZero NOM0189118971903190919151921192719331939194519511957196319691975198119871993199920052011201720232029203520412047Source: <strong>Australia</strong>n Bureau of Statistics <strong>and</strong> Department of Immigration <strong>and</strong> Citizenship projections.<strong>Australia</strong>n Bureau of Statistics shows that the fall in NOM has now ceased, <strong>and</strong> theDepartment’s forecasts are for it to gradually increase to around 200,000 persons perannum by 2015.Beyond 2015, the size <strong>and</strong> mix of NOM arrivals <strong>and</strong> NOM departures will shape <strong>and</strong>transform the population in <strong>Australia</strong> even more than it has done over the past 60years. This is because the relative importance of natural increase in population growthwill diminish, while that of the net migrant intake will increase.Elsewhere in this volume there are discussions of population projections, which we donot intend to rehash. An important implication from our preceding analysis, however,is that the size of the future migration intake is highly uncertain, as are the varioussub-components. They are, as the econometricians say, stochastic variables. If thatis accepted, it makes long-term population projections like those published by the<strong>Australia</strong>n Bureau of Statistics, <strong>and</strong> those included in the 2010 Intergenerational Report,hazardous to use as a basis for population planning. Demographers are increasinglylooking to Bayesian <strong>and</strong> stochastic approaches to population projections, ones whichassign probabilities to different population outcomes. It may be fruitful to explore thesein <strong>Australia</strong> (as Peter McDonald suggests, in Chapter 2.1).One useful application of population projections can be to answer “what if” style questions.As the parameters around fertility <strong>and</strong> mortality rates are far more stable than fornet migration rates, it is possible to answer questions about the future population of<strong>Australia</strong> by supposing there are different average levels of net migration.This approach is adopted to project the size of the overseas-born population in <strong>Australia</strong>by 2050 using a st<strong>and</strong>ard demographic model. As far as possible the model is designedto be consistent with that used by Treasury in the 2010 Intergenerational Report. 20 Fourdifferent net migration scenarios are modelled, incorporating the latest official data onbirths, fertility rate, deaths, life expectancy <strong>and</strong> the age-gender composition of NOM. 21Core assumptions are an unchanged total fertility rate of 1.92 births per woman from2011 <strong>and</strong> continuing upward trends in life expectancy. The four scenarios are a highlevel of NOM (300,000 per annum), a medium level (180,000 per annum), a low level(100,000 per annum) <strong>and</strong> a no net migration scenario. The assumption of a constantlevel of NOM – rather than, say, a constant rate of NOM to population – follows theapproach taken in the 2010 Intergenerational Report <strong>and</strong> the medium NOM scenario isthe same as that used in its base case projection. 22 For each scenario the total size ofA <strong>Greater</strong> <strong>Australia</strong>: <strong>Population</strong>, Policies <strong>and</strong> Governance69