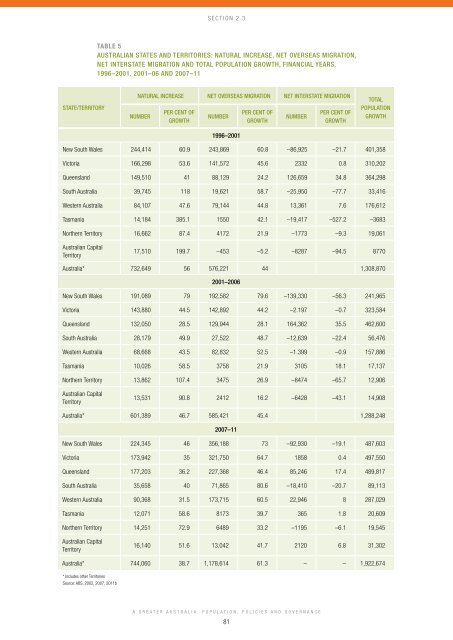
Section 2.3Table 5<strong>Australia</strong>n States <strong>and</strong> Territories: Natural Increase, Net Overseas Migration,Net Interstate Migration <strong>and</strong> Total <strong>Population</strong> Growth, Financial Years,1996–2001, 2001–06 <strong>and</strong> 2007–11State/TerritoryNatural increase Net overseas migration Net interstate migrationNumberPer cent ofgrowthNumber1996–2001Per cent ofgrowthNumberPer cent ofgrowthTotalpopulationgrowthNew South Wales 244,414 60.9 243,869 60.8 –86,925 –21.7 401,358Victoria 166,298 53.6 141,572 45.6 2332 0.8 310,202Queensl<strong>and</strong> 149,510 41 88,129 24.2 126,659 34.8 364,298South <strong>Australia</strong> 39,745 118 19,621 58.7 –25,950 –77.7 33,416Western <strong>Australia</strong> 84,107 47.6 79,144 44.8 13,361 7.6 176,612Tasmania 14,184 385.1 1550 42.1 –19,417 –527.2 –3683Northern Territory 16,662 87.4 4172 21.9 –1773 –9.3 19,061<strong>Australia</strong>n CapitalTerritory17,510 199.7 –453 –5.2 –8287 –94.5 8770<strong>Australia</strong>* 732,649 56 576,221 44 1,308,8702001–2006New South Wales 191,089 79 192,582 79.6 –139,330 –56.3 241,965Victoria 143,880 44.5 142,892 44.2 –2.197 –0.7 323,584Queensl<strong>and</strong> 132,050 28.5 129,944 28.1 164,362 35.5 462,600South <strong>Australia</strong> 28,179 49.9 27,522 48.7 –12,639 –22.4 56,476Western <strong>Australia</strong> 68,668 43.5 82,832 52.5 –1.399 –0.9 157,886Tasmania 10,026 58.5 3758 21.9 3105 18.1 17,137Northern Territory 13,862 107.4 3475 26.9 –8474 –65.7 12,906<strong>Australia</strong>n CapitalTerritory13,531 90.8 2412 16.2 –6428 –43.1 14,908<strong>Australia</strong>* 601,389 46.7 585,421 45.4 1,288,2482007–11New South Wales 224,345 46 356,188 73 –92,930 –19.1 487,603Victoria 173,942 35 321,750 64.7 1858 0.4 497,550Queensl<strong>and</strong> 177,203 36.2 227,368 46.4 85,246 17.4 489,817South <strong>Australia</strong> 35,658 40 71,865 80.6 –18,410 –20.7 89,113Western <strong>Australia</strong> 90,368 31.5 173,715 60.5 22,946 8 287,029Tasmania 12,071 58.6 8173 39.7 365 1.8 20,609Northern Territory 14,251 72.9 6489 33.2 –1195 –6.1 19,545<strong>Australia</strong>n CapitalTerritory16,140 51.6 13,042 41.7 2120 6.8 31,302<strong>Australia</strong>* 744,060 38.7 1,178,614 61.3 – – 1,922,674* Includes other TerritoriesSource: ABS, 2002, 2007, 2011bA <strong>Greater</strong> <strong>Australia</strong>: <strong>Population</strong>, Policies <strong>and</strong> Governance81
Section 2.3Table 6Sydney, Melbourne, Brisbane, Perth <strong>and</strong> Adelaide: Estimated Components of<strong>Population</strong> Change, 1996–2001 <strong>and</strong> 2001–06NaturalincreaseNetinternationalmigrationNet internalmigrationTotalmigrationTotalpopulationincrease1996–2001Sydney 000s 149 168 –61 107 256Per cent 58.2 65.6 –23.8 41.8 100Melbourne 000s 109 108 11 119 228Per cent 47.8 47.4 4.8 52.2 100Brisbane 000s 58 31 50 81 139Per cent 41.7 22.3 36 58.3 100Perth ‘000s 47 40 9 49 96Per cent 49 41.7 9.4 51 100Adelaide ‘000s 22 9 –4 5 27Per cent 81.5 33.3 –14.8 18.5 1002001–2006Sydney 000s 159 84 –121 –37 122Per cent 130.3 68.9 –99.2 –30.3 100Melbourne 000s 121 124 –19 105 226Per cent 53.5 54.9 –8.4 46.5 100Brisbane 000s 66 27 43 70 136Per cent 48.5 19.9 31.6 51.5 100Perth ‘000s 49 53 3 56 105Per cent 46.7 50.5 2.9 53.3 100Adelaide ‘000s 21 22 –10 12 33Per cent 63.6 66.7 –30.3 36.4 100Source: ABS unpublished dataexperienced by the nation’s two largest cities, dwarfed by the net gain of immigrantsfrom overseas, which accounted for more than half of this expansion. However, duringthe 1976–96 period, a quite different pattern was evident, with a substantial net internalmigration loss being recorded in both large cities, although international migrationremained an important source of growth, especially in Sydney.Some differences are evident in the most recent decade. In 1996–2001 there was areduced net loss in Sydney, perhaps associated with the growth created by the 2000Olympic Games. However, since then the massive net interstate migration losses haveresumed. In Melbourne there were small net interstate migration gains in 1996–2001but a net out-migration of 18,000 in 2001–06. Hence Sydney, <strong>and</strong> to a much lesserextent Melbourne, have been important sources of internal migrants to the rest of<strong>Australia</strong> while the fact that international migrants have disproportionately settled in<strong>Australia</strong>’s two largest cities has been the major migration driver of their growth.A <strong>Greater</strong> <strong>Australia</strong>: <strong>Population</strong>, Policies <strong>and</strong> Governance82
- Page 2 and 3:
A Greater Australia:Population, pol
- Page 4 and 5:
ContentsForeword CEDA Chief Executi
- Page 6 and 7:
ForewordIt is with pleasure that I
- Page 8 and 9:
IntroductionResponding to the resul
- Page 10 and 11:
IntroductionA more dynamic and vita
- Page 12 and 13:
IntroductionSustainabilityConcern a
- Page 14 and 15:
IntroductionThe new demographics, h
- Page 16 and 17:
Section 1.0Historical perspectives1
- Page 18 and 19:
Section 1.1IntroductionJapan’s cr
- Page 20 and 21:
Section 1.1Figure 1Forecast number
- Page 22 and 23:
Section 1.1Table 1Defence spending
- Page 24 and 25:
Section 1.1How much defence is enou
- Page 26 and 27:
Section 1.1ConclusionA substantial
- Page 28 and 29:
Section 1.2There has been over a ce
- Page 30 and 31:
Section 1.2Resource constraints wer
- Page 32 and 33: Section 1.2Similarly, in the 1994 H
- Page 34 and 35: Section 1.2ReferencesAustralia, Dep
- Page 36 and 37: Section 1.3IntroductionAustralia is
- Page 38 and 39: Section 1.3The grey 90sThe heady ex
- Page 40 and 41: Section 1.3Taylor’s stony rebutta
- Page 42 and 43: Section 1.3Figure 1The Benhamite Op
- Page 44 and 45: Section 1.3In mathematical terms, t
- Page 46 and 47: Section 1.3characterisation of the
- Page 48 and 49: Section 1.3ConclusionA retrospectiv
- Page 50 and 51: Section 2.0Population futures2.1 Fo
- Page 52 and 53: Section 2.1Conventional population
- Page 54 and 55: Section 2.1It is more useful for go
- Page 56 and 57: Section 2.1Forecasting of births, w
- Page 58 and 59: Section 2.1Future net overseas migr
- Page 60 and 61: Section 2.13). This had a lot to do
- Page 62 and 63: Section 2.2IntroductionIn late Sept
- Page 64 and 65: Section 2.2Figure 1The migrant cont
- Page 66 and 67: Section 2.2The visa and residency s
- Page 68 and 69: Section 2.2sponsorship, subject to
- Page 70 and 71: Section 2.2Figure 3Historical and p
- Page 72 and 73: Section 2.2The views in this chapte
- Page 74 and 75: Section 2.3IntroductionThe Australi
- Page 76 and 77: Section 2.3Figure 3Australia: Distr
- Page 78 and 79: Section 2.3Table 2Australia: Popula
- Page 80 and 81: Section 2.3Table 4Views of Australi
- Page 84 and 85: Section 2.3A number of hypotheses h
- Page 86 and 87: Section 2.3Table 8Australia: Distri
- Page 88 and 89: Section 2.3Table 10Non-Metropolitan
- Page 90 and 91: Section 2.3Policy issuesThe configu
- Page 92 and 93: Section 2.3Climate change is likely
- Page 94 and 95: Section 2.3ConclusionAny realistic
- Page 96 and 97: Section 2.340 Swan, W., 2010.Austra
- Page 98 and 99: Section 2.4IntroductionThe Australi
- Page 100 and 101: Section 2.4At present there is a hi
- Page 102 and 103: Section 2.4innovation initiatives w
- Page 104 and 105: Section 2.4Endnotes1 Henry, K 2009,
- Page 106 and 107: Section 2.5IntroductionAustralia is
- Page 108 and 109: Section 2.5else. Even with a broad
- Page 110 and 111: Section 2.5commercially viable - th
- Page 112 and 113: Section 2.5A vast country like Aust
- Page 114 and 115: Section 3.0Society and the individu
- Page 116 and 117: Section 3.1Extent of public opinion
- Page 119 and 120: Section 3.1category immigrant/forei
- Page 121 and 122: Section 3.1The Environics Research
- Page 123 and 124: Section 3.1Per cent100908070Figure
- Page 125 and 126: Section 3.1A number of surveys soug
- Page 127 and 128: Section 3.1Table 8Percentage who an
- Page 129 and 130: Section 3.1A more precise indicatio
- Page 131 and 132: Section 3.1The strongest predictor
- Page 133 and 134:
Section 3.1Endnotes1. There is also
- Page 135 and 136:
3.2Social inclusion and multicultur
- Page 137 and 138:
Section 3.2a broader definition of
- Page 139 and 140:
Section 3.2Figure 1Estimated povert
- Page 141 and 142:
Section 3.2Table 2Visa Type of Sett
- Page 143 and 144:
Section 3.2Table 5First Generation
- Page 145 and 146:
Section 3.2Table 6Australia: First
- Page 147 and 148:
Section 3.2Improving outcomes for v
- Page 149 and 150:
Section 3.2increasing diversity of
- Page 151 and 152:
3.3Linkages between education and p
- Page 153 and 154:
Section 3.3Education and productivi
- Page 155 and 156:
Section 3.3In the past decade, prod
- Page 157 and 158:
Section 3.3succeed in education or
- Page 159 and 160:
Section 3.3case, funding also could
- Page 161 and 162:
Section 3.3Endnotes1 IGR 2010: Chal
- Page 163 and 164:
3.4Healthcare delivery for our agei
- Page 165 and 166:
Section 3.4• Private medical serv
- Page 167 and 168:
Section 3.4the whole spectrum of in
- Page 169 and 170:
Section 3.45. Experiences, pathways
- Page 171 and 172:
Section 3.4Stratification of patien
- Page 173 and 174:
Section 3.4Other steps include impr
- Page 175 and 176:
Section 3.438 National Health Refor
- Page 177 and 178:
4.1The economic effects ofpopulatio
- Page 179 and 180:
Section 4.1population growth can ex
- Page 181 and 182:
Section 4.1In theory, the answer pa
- Page 183 and 184:
Section 4.1Kirchner concedes that t
- Page 185 and 186:
Section 4.1Endnotes1. Productivity
- Page 187 and 188:
4.2Urban infrastructure and land us
- Page 189 and 190:
Section 4.2bearing the fixed costs
- Page 191 and 192:
Section 4.2Figure 1Indicative dwell
- Page 193 and 194:
Section 4.2Taking the electricity,
- Page 195 and 196:
Section 4.2Promoting better land us
- Page 197 and 198:
Section 4.2preferences to homeowner
- Page 199 and 200:
Section 4.2in any Australian urban
- Page 201 and 202:
Section 4.2Endnotes1 Productivity C
- Page 203 and 204:
4.3Water security:Water for the far
- Page 205 and 206:
Section 4.3Water trading enables us
- Page 207 and 208:
Section 4.3cent of water entitlemen
- Page 209 and 210:
Section 4.3were either the full eco
- Page 211 and 212:
Section 4.3Strategic opportunitiesA
- Page 213 and 214:
4.4Critiquing governmentregional de
- Page 215 and 216:
Section 4.4However, there is often
- Page 217 and 218:
Section 4.4Potential policy interve
- Page 219 and 220:
Section 4.4Unfortunately, advocacy
- Page 221 and 222:
Section 4.4contribute substantially
- Page 223 and 224:
Section 4.418 Department of Educati
- Page 225 and 226:
5.1The future of population policyG
- Page 227 and 228:
Section 5.1a million fewer women in
- Page 229 and 230:
Section 5.1For the present, ongoing
- Page 231 and 232:
Section 5.1The second worry is that
- Page 233 and 234:
Section 5.1The now significantly de


