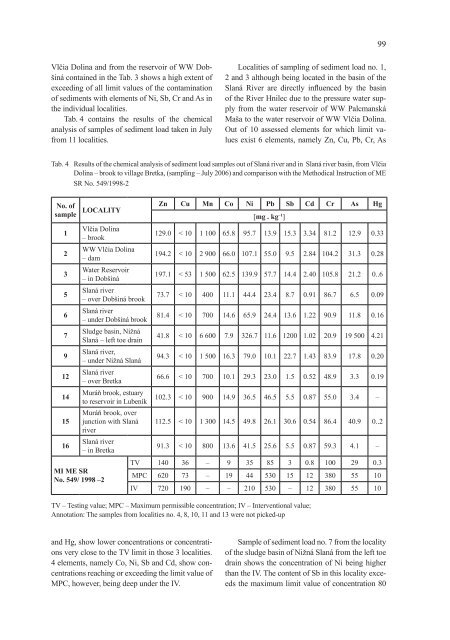
99Vlčia Dolina and from the reser<strong>vo</strong>ir of WW Dobšinácontained in the Tab. 3 shows a high extent ofexceeding of all limit values of the contaminationof sediments with elements of Ni, Sb, Cr and As inthe individual localities.Tab. 4 contains the results of the chemicalanalysis of samples of sediment load taken in Julyfrom 11 localities.Localities of sampling of sediment load no. 1,2 and 3 although being located in the basin of theSlaná River are directly influenced by the basinof the River Hnilec due to the pressure water supplyfrom the water reser<strong>vo</strong>ir of WW PalcmanskáMaša to the water reser<strong>vo</strong>ir of WW Vlčia Dolina.Out of 10 assessed elements for which limit valuesexist 6 elements, namely Zn, Cu, Pb, Cr, AsTab. 4 Results of the chemical analysis of sediment load samples out of Slaná river and in Slaná river basin, from VlčiaDolina – brook to village Bretka, (sampling – July 2006) and comparison with the Methodical Instruction of MESR No. 549/1998-2No. ofsample LOCALITY Zn Cu Mn Co Ni Pb Sb Cd Cr As Hg[mg . kg –1 ]1Vlčia Dolina– brook129.0 < 10 1 100 65.8 95.7 13.9 15.3 3.34 81.2 12.9 0.332WW Vlčia Dolina– dam194.2 < 10 2 900 66.0 107.1 55.0 9.5 2.84 104.2 31.3 0.283Water Reser<strong>vo</strong>ir– in Dobšiná197.1 < 53 1 500 62.5 139.9 57.7 14.4 2.40 105.8 21.2 0..65Slaná river– over Dobšiná brook73.7 < 10 400 11.1 44.4 23.4 8.7 0.91 86.7 6.5 0.096Slaná river– under Dobšiná brook81.4 < 10 700 14.6 65.9 24.4 13.6 1.22 90.9 11.8 0.167Sludge basin, NižnáSlaná – left toe drain41.8 < 10 6 600 7.9 326.7 11.6 1200 1.02 20.9 19 500 4.219Slaná river,– under Nižná Slaná94.3 < 10 1 500 16.3 79.0 10.1 22.7 1.43 83.9 17.8 0.2012Slaná river– over Bretka66.6 < 10 700 10.1 29.3 23.0 1.5 0.52 48.9 3.3 0.1914Muráň brook, estuaryto reser<strong>vo</strong>ir in Lubeník102.3 < 10 900 14.9 36.5 46.5 5.5 0.87 55.0 3.4 –15Muráň brook, overjunction with Slaná 112.5 < 10 1 300 14.5 49.8 26.1 30.6 0.54 86.4 40.9 0..2river16Slaná river– in Bretka91.3 < 10 800 13.6 41.5 25.6 5.5 0.87 59.3 4.1 –MI ME SRNo. 549/ 1998 –2TV 140 36 – 9 35 85 3 0.8 100 29 0.3MPC 620 73 – 19 44 530 15 12 380 55 10IV 720 190 – – 210 530 – 12 380 55 10TV – Testing value; MPC – Maximum permissible concentration; IV – Interventional value;Annotation: The samples from localities no. 4, 8, 10, 11 and 13 were not picked-upand Hg, show lower concentrations or concentrationsvery close to the TV limit in those 3 localities.4 elements, namely Co, Ni, Sb and Cd, show concentrationsreaching or exceeding the limit value ofMPC, however, being deep under the IV.Sample of sediment load no. 7 from the localityof the sludge basin of Nižná Slaná from the left toedrain shows the concentration of Ni being higherthan the IV. The content of Sb in this locality exceedsthe maximum limit value of concentration 80
100times, the content of As even 355 times.The samples of sediment load no. 4, 8, 10, 11and 13 were not picked-up. The remaining 7 samplesof sediment load (no. 5, 6, 9, 12, 14, 15, 16)taken from the bottom of the River Slaná and thebed of the brook of Muráň on different localitiesshowed concentrations of the selected elementslargely similar to the TV. Only the contents of theelements Ni in samples no. 6, 9 and 13 and Sb insamples no. 9 and 13 exceeded the MPC value. Thecontent of the selected elements in those 7 sampleswas deeply under the limit IV.A high level of contamination of sediment loadby the selected elements exceeding the limit MPCvalues as well as the IV is according to Tab. 3 and4 shown especially in the sediment load of the waterreser<strong>vo</strong>ir of this basin and in the deposits in theleft outflow drain from the sludge basin of NižnáSlaná.CONCLUSIONThe results of analyses of the water and sedimentload (bottom deposits) samples, picked up inthe selected localities, influenced by old and presentmining activities and their assessment maystate the following:– The outflow of mining waters from old miningworks in the basin of the River Slaná, especiallythe outflow from the Mária mine and theoutflow from the old sludge “Čučma“ in Rožňavamay have a negative impact on the level ofwater contamination in the River Slaná in caseof minimum flow rates by several selected elements.However, after flowing to the River Slanáand mixing with its water the analyses of thesamples procured have shown that the contentof the selected elements was on the level thatis in accordance with the valid requirements forthe quality of the surface water.– Analyses of samples of water from the outflowof the left toe drain and from the surface of theactive sludge basin of Nižná Slaná have shownthat this sludge basin may also have a negativeimpact on the content of several elements in thewater of the River Slaná, especially in case ofminimum flow rates.– However, the samples of sediment load (bottomdeposits) procured in the same localities as thesamples of water that were thanks to their granulometrysuitable for the chemical analysishave shown that almost all analysed sampleshave the content of the selected elements closeto the level of the TV of the valid standard forthe environment or they slightly exceed it. It istrue especially for the content of Hg from thelocality of Vlčia Dolina – brook up to the riverof Slaná in Nižná Slaná,– almost two thirds of elements from the majorityof localities exceed the value of the maximumpermitted concentration – MPC,– elements Co, Ni, Sb, Cr in the monitored localitiesof water reser<strong>vo</strong>irs and in the left toe drainof the sludge basin of Nižná Slaná significantlyexceed the intervention value – IV of the validstandard for the environment,– keeping of water in water reser<strong>vo</strong>irs contributesto the increase of the contents of selected elementsin the sediment load (bottom deposits).Monitoring of contamination of water and sedimentload in the selected profiles in the basin ofSlaná as well as Hnilec need to be continued bysampling and analysing of samples.AcknowledgementsThis work was supported by the Slovak GrantAgency for Science VEGA grant No. 2/7045/27and the Slovak Research and Development Agencyunder the contract No. APVV-51-027705.REFERENCES1. BOLDIŠ, M., ŠTEFANČA, P.: European iron road,Gemer the iron heart of central Europe. Projectwas realized with the financial contribution of CBCPhare. Publisher – Regional agency for development– Rožňava.2. Governmental Regulation of SR No. 296/2005 Coll.,Annex No.13. LUKÁČ, S.: Row material base and state of mineand processing equipment in works Siderit NižnáSlaná. <strong>Acta</strong> Montanistica Slovaca. Vol. 7 (2002), No.4, pp. 227–230.4. The waterworks Dobšiná. Purpose publication – Po<strong>vo</strong>dieBodrogu a Hornádu Košice. August 1993.5. Methodical Instruction of the Ministry of Environmentof the Slovak Republic No.549/1998-2.
- Page 2 and 3:
Acta FacultatisEcologiaeJournal of
- Page 4 and 5:
OBSAH / CONTENTSISOL M., MICHALÍKO
- Page 6:
5ACTA FACULTATIS ECOLOGIAE, 16: Sup
- Page 12:
11ACTA FACULTATIS ECOLOGIAE, 16: Su
- Page 18 and 19:
17ACTA FACULTATIS ECOLOGIAE, 16: Su
- Page 20 and 21:
19are lower in ill patients compare
- Page 22:
21are considered as the most accura
- Page 25 and 26:
24- multimode cavities are usually
- Page 27 and 28:
26the load during its exposure to f
- Page 29 and 30:
28Tradescantia paludosa 02 test and
- Page 31 and 32:
30Tab. 5: Results of positive contr
- Page 34 and 35:
33ACTA FACULTATIS ECOLOGIAE, 16: Su
- Page 36 and 37:
35DISCUSSIONThe ionising radiation
- Page 38 and 39:
37ACTA FACULTATIS ECOLOGIAE, 16: Su
- Page 40 and 41:
39222Rn is produced by radioactive
- Page 42 and 43:
41180160140this reason we also pick
- Page 44:
435001450400350hKz0,8h [m]300250200
- Page 47 and 48:
46deposit is that stripped in off-l
- Page 49 and 50: 48TruenessTrueness was determined i
- Page 51 and 52: 50MATERIAL AND METHODSChloroform (p
- Page 53 and 54: 52absorbance [a.u.]1,000,750,500,25
- Page 55 and 56: 54Tab. 1: Rrequirements determinati
- Page 57 and 58: 56Methods of VOC testing were set a
- Page 60 and 61: 59Tab. 6: ContinuedSamples withsurf
- Page 62 and 63: 61ACTA FACULTATIS ECOLOGIAE, 16: Su
- Page 64 and 65: 63One of the possible explanations
- Page 66 and 67: 65Ai - Ai-1 [Bq.m -3 ]86420-2-4-6-8
- Page 68 and 69: 67ACTA FACULTATIS ECOLOGIAE, 15: Su
- Page 70 and 71: 69BiodegradabilityThe great variety
- Page 72 and 73: 71degradation starts of late days,
- Page 74 and 75: 73Fig. 4 Treated (after 28 days of
- Page 76: 75parameters of the cutting process
- Page 80 and 81: 79Fraction: D (residual rest) prese
- Page 82: 81was not confirmed. Maximum of mer
- Page 85 and 86: 84Fig. 1 Schematic diagram of atomi
- Page 87 and 88: 86Alpha spectrometryAlpha spectrome
- Page 89 and 90: 8880007000y = 6622xR 2 = 0.939SIMS
- Page 92 and 93: 91ACTA FACULTATIS ECOLOGIAE, 16: Su
- Page 94 and 95: 93Gemer according to the German mod
- Page 96 and 97: 95Tab. 1 Results of the chemical an
- Page 98 and 99: 97Continuation of Tab. 2 Results of
- Page 102 and 103: 101ACTA FACULTATIS ECOLOGIAE, 16: S
- Page 104 and 105: 103mg.dm -3mg.dm -35,004,003,002,00
- Page 106 and 107: 105year and the average value repre
- Page 108 and 109: 107ACTA FACULTATIS ECOLOGIAE, 16: S
- Page 110 and 111: 109Sample site 1 Sample site 2 Samp
- Page 112 and 113: 111As for the sampling time (Fig. 5
- Page 114 and 115: 113ACTA FACULTATIS ECOLOGIAE, 16: S
- Page 116 and 117: 115Typha latifolia, Carex sp., Scir
- Page 118 and 119: 117conditions for decomposition of
- Page 120 and 121: 119ACTA FACULTATIS ECOLOGIAE, 16: S
- Page 122 and 123: 121from the background (derived fro
- Page 124 and 125: 12311. PETROVSKÝ, E., ELWOOD, B.:
- Page 126 and 127: 125ACTA FACULTATIS ECOLOGIAE, 16: S
- Page 128 and 129: 1272.52.0Correlation coefficient 0,
- Page 130 and 131: 129ACTA FACULTATIS ECOLOGIAE, 16: S
- Page 132 and 133: 131RESULTS AND DISCUSSIONTable 2 gi
- Page 134 and 135: 133ACTA FACULTATIS ECOLOGIAE, 16: S
- Page 136 and 137: 135V-1 BOREHOLEThe courses of 222 R
- Page 138 and 139: 137AV-2 (40m) 2006A ( 222 Rn) [kBq/
- Page 140 and 141: 139soaks into the soil, another par
- Page 142 and 143: 141ACTA FACULTATIS ECOLOGIAE, 16: S
- Page 144 and 145: 143Fig. 2 The continuous monitoring
- Page 146 and 147: 145Indoor radon activity concentrat
- Page 148 and 149: 147ACTA FACULTATIS ECOLOGIAE, 16: S
- Page 150 and 151:
149Fig. 1 Podlipa dump-fieldCanada)
- Page 152 and 153:
151concentrations of Fe. Cu. Cd. Ni
- Page 154 and 155:
153DUMP-FIELDREFERENCE SITEppm15001
- Page 156 and 157:
155Fig. 5 Compression of wood forma
- Page 158 and 159:
157decrease in the following order:
- Page 160 and 161:
159ACTA FACULTATIS ECOLOGIAE, 16: S
- Page 162 and 163:
161SPECIFIC EXAMPLES OFFACTORS THAT
- Page 164 and 165:
163ACTA FACULTATIS ECOLOGIAE, 16: S
- Page 166 and 167:
165The methods developed to incorpo
- Page 168 and 169:
167The effects of wind on ozone con
- Page 170 and 171:
169Fig. 6 Mean total and stomatal f
- Page 172 and 173:
171transport modelling in North Ame
- Page 175:
Acta Facultatis Ecologiae, Volume 1