Acta Facultatis Ecologiae - Technická univerzita vo Zvolene
Acta Facultatis Ecologiae - Technická univerzita vo Zvolene
Acta Facultatis Ecologiae - Technická univerzita vo Zvolene
- No tags were found...

You also want an ePaper? Increase the reach of your titles
YUMPU automatically turns print PDFs into web optimized ePapers that Google loves.
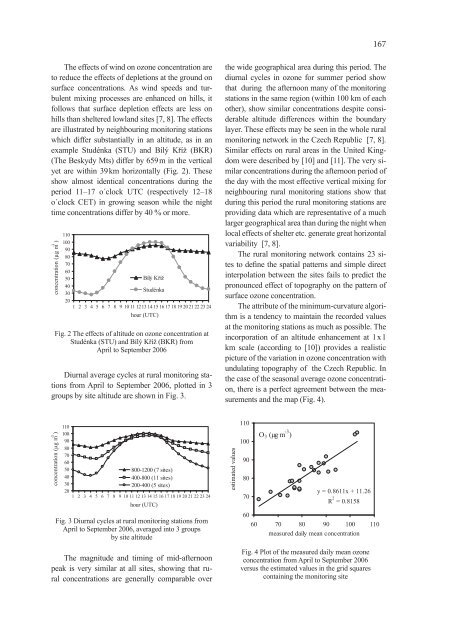
167The effects of wind on ozone concentration areto reduce the effects of depletions at the ground onsurface concentrations. As wind speeds and turbulentmixing processes are enhanced on hills, itfollows that surface depletion effects are less onhills than sheltered lowland sites [7, 8]. The effectsare illustrated by neighbouring monitoring stationswhich differ substantially in an altitude, as in anexample Studénka (STU) and Bílý Kříž (BKR)(The Beskydy Mts) differ by 659 m in the verticalyet are within 39 km horizontally (Fig. 2). Theseshow almost identical concentrations during theperiod 11–17 o´clock UTC (respectively 12–18o´clock CET) in growing season while the nighttime concentrations differ by 40 % or more.)-3concentration (µg m1101009080706050403020Bílý KížStudénka1 2 3 4 5 6 7 8 9 10 11 1213 14 15 16 17 18 19 2021 22 23 24hour (UTC)Fig. 2 The effects of altitude on ozone concentration atStudénka (STU) and Bílý Kříž (BKR) fromApril to September 2006Diurnal average cycles at rural monitoring stationsfrom April to September 2006, plotted in 3groups by site altitude are shown in Fig. 3.the wide geographical area during this period. Thediurnal cycles in ozone for summer period showthat during the afternoon many of the monitoringstations in the same region (within 100 km of eachother), show similar concentrations despite considerablealtitude differences within the boundarylayer. These effects may be seen in the whole ruralmonitoring network in the Czech Republic [7, 8].Similar effects on rural areas in the United Kingdomwere described by [10] and [11]. The very similarconcentrations during the afternoon period ofthe day with the most effective vertical mixing forneighbouring rural monitoring stations show thatduring this period the rural monitoring stations areproviding data which are representative of a muchlarger geographical area than during the night whenlocal effects of shelter etc. generate great horizontalvariability [7, 8].The rural monitoring network contains 23 sitesto define the spatial patterns and simple directinterpolation between the sites fails to predict thepronounced effect of topography on the pattern ofsurface ozone concentration.The attribute of the minimum-curvature algorithmis a tendency to maintain the recorded valuesat the monitoring stations as much as possible. Theincorporation of an altitude enhancement at 1 x 1km scale (according to [10]) provides a realisticpicture of the variation in ozone concentration withundulating topography of the Czech Republic. Inthe case of the seasonal average ozone concentration,there is a perfect agreement between the measurementsand the map (Fig. 4).)-3concentration (µg m1101009080706050403020800-1200 (7 sites)400-800 (11 sites)200-400 (5 sites)1 2 3 4 5 6 7 8 9 10 11 12 13 14 15 16 17 18 19 20 21 22 23 24hour (UTC)Fig. 3 Diurnal cycles at rural monitoring stations fromApril to September 2006, averaged into 3 groupsby site altitudeThe magnitude and timing of mid-afternoonpeak is very similar at all sites, showing that ruralconcentrations are generally comparable overestimated values11010090807060O 3 (µg m -3 )y = 0.8611x + 11.26R 2 = 0.815860 70 80 90 100 110measured daily mean concentrationFig. 4 Plot of the measured daily mean ozoneconcentration from April to September 2006versus the estimated values in the grid squarescontaining the monitoring site