Acta Facultatis Ecologiae - Technická univerzita vo Zvolene
Acta Facultatis Ecologiae - Technická univerzita vo Zvolene
Acta Facultatis Ecologiae - Technická univerzita vo Zvolene
- No tags were found...

You also want an ePaper? Increase the reach of your titles
YUMPU automatically turns print PDFs into web optimized ePapers that Google loves.
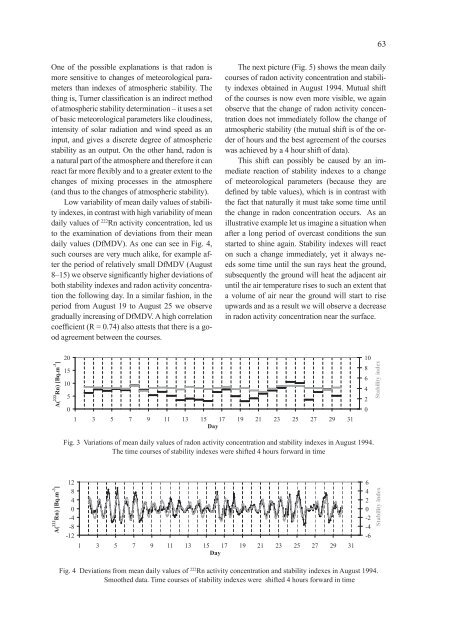
63One of the possible explanations is that radon ismore sensitive to changes of meteorological parametersthan indexes of atmospheric stability. Thething is, Turner classification is an indirect methodof atmospheric stability determination – it uses a setof basic meteorological parameters like cloudiness,intensity of solar radiation and wind speed as aninput, and gives a discrete degree of atmosphericstability as an output. On the other hand, radon isa natural part of the atmosphere and therefore it canreact far more flexibly and to a greater extent to thechanges of mixing processes in the atmosphere(and thus to the changes of atmospheric stability).Low variability of mean daily values of stabilityindexes, in contrast with high variability of meandaily values of 222 Rn activity concentration, led usto the examination of deviations from their meandaily values (DfMDV). As one can see in Fig. 4,such courses are very much alike, for example afterthe period of relatively small DfMDV (August8–15) we observe significantly higher deviations ofboth stability indexes and radon activity concentrationthe following day. In a similar fashion, in theperiod from August 19 to August 25 we observegradually increasing of DfMDV. A high correlationcoefficient (R = 0.74) also attests that there is a goodagreement between the courses.The next picture (Fig. 5) shows the mean dailycourses of radon activity concentration and stabilityindexes obtained in August 1994. Mutual shiftof the courses is now even more visible, we againobserve that the change of radon activity concentrationdoes not immediately follow the change ofatmospheric stability (the mutual shift is of the orderof hours and the best agreement of the courseswas achieved by a 4 hour shift of data).This shift can possibly be caused by an immediatereaction of stability indexes to a changeof meteorological parameters (because they aredefined by table values), which is in contrast withthe fact that naturally it must take some time untilthe change in radon concentration occurs. As anillustrative example let us imagine a situation whenafter a long period of overcast conditions the sunstarted to shine again. Stability indexes will reacton such a change immediately, yet it always needssome time until the sun rays heat the ground,subsequently the ground will heat the adjacent airuntil the air temperature rises to such an extent thata <strong>vo</strong>lume of air near the ground will start to riseupwards and as a result we will observe a decreasein radon activity concentration near the surface.A( 222 Rn) [Bq.m -3 ]201510501 3 5 7 9 11 13 15 17 19 21 23 25 27 29 31Day1086420Stability indexFig. 3 Variations of mean daily values of radon activity concentration and stability indexes in August 1994.The time courses of stability indexes were shifted 4 hours forward in timeA( 222 Rn) [Bq.m -3 ]12840-4-8-121 3 5 7 9 11 13 15 17 19 21 23 25 27 29 31Day6420-2-4-6Stability indexFig. 4 Deviations from mean daily values of 222 Rn activity concentration and stability indexes in August 1994.Smoothed data. Time courses of stability indexes were shifted 4 hours forward in time