- Page 2 and 3:
Acta FacultatisEcologiaeJournal of
- Page 4 and 5:
OBSAH / CONTENTSISOL M., MICHALÍKO
- Page 6:
5ACTA FACULTATIS ECOLOGIAE, 16: Sup
- Page 12:
11ACTA FACULTATIS ECOLOGIAE, 16: Su
- Page 18 and 19:
17ACTA FACULTATIS ECOLOGIAE, 16: Su
- Page 20 and 21:
19are lower in ill patients compare
- Page 22:
21are considered as the most accura
- Page 25 and 26:
24- multimode cavities are usually
- Page 27 and 28:
26the load during its exposure to f
- Page 29 and 30:
28Tradescantia paludosa 02 test and
- Page 31 and 32:
30Tab. 5: Results of positive contr
- Page 34 and 35:
33ACTA FACULTATIS ECOLOGIAE, 16: Su
- Page 36 and 37:
35DISCUSSIONThe ionising radiation
- Page 38 and 39:
37ACTA FACULTATIS ECOLOGIAE, 16: Su
- Page 40 and 41:
39222Rn is produced by radioactive
- Page 42 and 43:
41180160140this reason we also pick
- Page 44:
435001450400350hKz0,8h [m]300250200
- Page 47 and 48:
46deposit is that stripped in off-l
- Page 49 and 50:
48TruenessTrueness was determined i
- Page 51 and 52:
50MATERIAL AND METHODSChloroform (p
- Page 53 and 54:
52absorbance [a.u.]1,000,750,500,25
- Page 55 and 56:
54Tab. 1: Rrequirements determinati
- Page 57 and 58:
56Methods of VOC testing were set a
- Page 60 and 61:
59Tab. 6: ContinuedSamples withsurf
- Page 62 and 63:
61ACTA FACULTATIS ECOLOGIAE, 16: Su
- Page 64 and 65:
63One of the possible explanations
- Page 66 and 67:
65Ai - Ai-1 [Bq.m -3 ]86420-2-4-6-8
- Page 68 and 69:
67ACTA FACULTATIS ECOLOGIAE, 15: Su
- Page 70 and 71:
69BiodegradabilityThe great variety
- Page 72 and 73:
71degradation starts of late days,
- Page 74 and 75:
73Fig. 4 Treated (after 28 days of
- Page 76:
75parameters of the cutting process
- Page 80 and 81:
79Fraction: D (residual rest) prese
- Page 82:
81was not confirmed. Maximum of mer
- Page 85 and 86:
84Fig. 1 Schematic diagram of atomi
- Page 87 and 88:
86Alpha spectrometryAlpha spectrome
- Page 89 and 90:
8880007000y = 6622xR 2 = 0.939SIMS
- Page 92 and 93:
91ACTA FACULTATIS ECOLOGIAE, 16: Su
- Page 94 and 95: 93Gemer according to the German mod
- Page 96 and 97: 95Tab. 1 Results of the chemical an
- Page 98 and 99: 97Continuation of Tab. 2 Results of
- Page 100 and 101: 99Vlčia Dolina and from the reserv
- Page 102 and 103: 101ACTA FACULTATIS ECOLOGIAE, 16: S
- Page 104 and 105: 103mg.dm -3mg.dm -35,004,003,002,00
- Page 106 and 107: 105year and the average value repre
- Page 108 and 109: 107ACTA FACULTATIS ECOLOGIAE, 16: S
- Page 110 and 111: 109Sample site 1 Sample site 2 Samp
- Page 112 and 113: 111As for the sampling time (Fig. 5
- Page 114 and 115: 113ACTA FACULTATIS ECOLOGIAE, 16: S
- Page 116 and 117: 115Typha latifolia, Carex sp., Scir
- Page 118 and 119: 117conditions for decomposition of
- Page 120 and 121: 119ACTA FACULTATIS ECOLOGIAE, 16: S
- Page 122 and 123: 121from the background (derived fro
- Page 124 and 125: 12311. PETROVSKÝ, E., ELWOOD, B.:
- Page 126 and 127: 125ACTA FACULTATIS ECOLOGIAE, 16: S
- Page 128 and 129: 1272.52.0Correlation coefficient 0,
- Page 130 and 131: 129ACTA FACULTATIS ECOLOGIAE, 16: S
- Page 132 and 133: 131RESULTS AND DISCUSSIONTable 2 gi
- Page 134 and 135: 133ACTA FACULTATIS ECOLOGIAE, 16: S
- Page 136 and 137: 135V-1 BOREHOLEThe courses of 222 R
- Page 138 and 139: 137AV-2 (40m) 2006A ( 222 Rn) [kBq/
- Page 140 and 141: 139soaks into the soil, another par
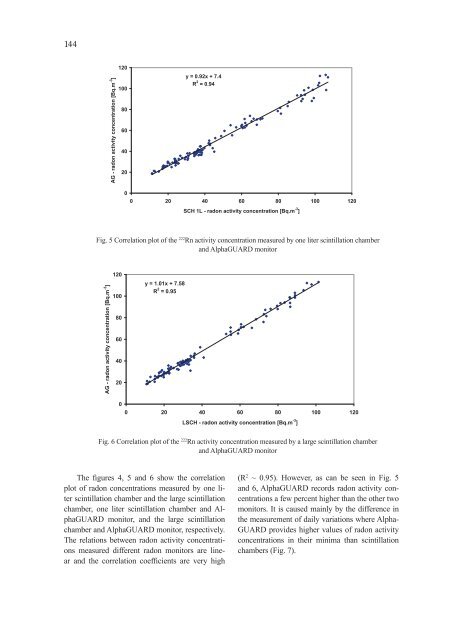
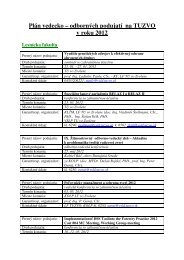
- Page 142 and 143: 141ACTA FACULTATIS ECOLOGIAE, 16: S
- Page 146 and 147: 145Indoor radon activity concentrat
- Page 148 and 149: 147ACTA FACULTATIS ECOLOGIAE, 16: S
- Page 150 and 151: 149Fig. 1 Podlipa dump-fieldCanada)
- Page 152 and 153: 151concentrations of Fe. Cu. Cd. Ni
- Page 154 and 155: 153DUMP-FIELDREFERENCE SITEppm15001
- Page 156 and 157: 155Fig. 5 Compression of wood forma
- Page 158 and 159: 157decrease in the following order:
- Page 160 and 161: 159ACTA FACULTATIS ECOLOGIAE, 16: S
- Page 162 and 163: 161SPECIFIC EXAMPLES OFFACTORS THAT
- Page 164 and 165: 163ACTA FACULTATIS ECOLOGIAE, 16: S
- Page 166 and 167: 165The methods developed to incorpo
- Page 168 and 169: 167The effects of wind on ozone con
- Page 170 and 171: 169Fig. 6 Mean total and stomatal f
- Page 172 and 173: 171transport modelling in North Ame
- Page 175: Acta Facultatis Ecologiae, Volume 1