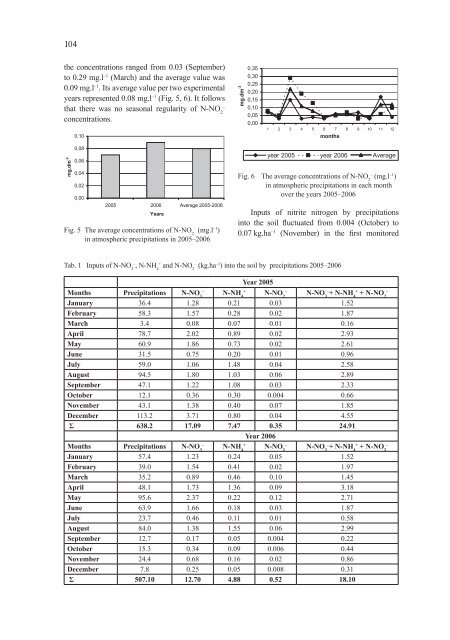
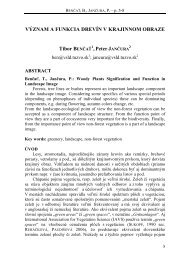
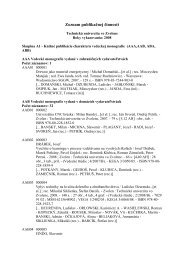
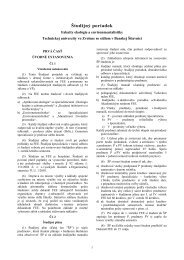
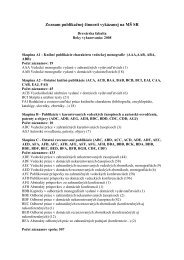
103mg.dm -3mg.dm -35,004,003,002,001,000,001 2 3 4 5 6 7 8 9 10 11 12months1,401,201,000,800,600,400,200,002005 2006 Average 2005-2006YearsYear 2005 Year 2006 AverageFig. 2 The average concentrations of N-NO 3–(mg.l –1 )in atmospheric precipitations in each month overthe years 2005–2006period 14.90 kg of N-NO 3–.ha –1 infiltrated into thesoil by precipitations on the average per year. Noskovič,Gábriš (1995) found out that 5.71 kg of N-NO 3–got into the soil in surroundings of Nitra. Thisimplies that the amount of N-NO 3–which got intothe soil in Dolná Malanta over the monitored yearsdepended on their concentrations in precipitationsand also on the efficiency of precipitations.Nitrate nitrogen ratio made up of 68.19 %of the total sum N-NO 3–+ N-NH 4++ N-NO 2–(mg.l –1 ) in 2005 and in 2006 it made up to 78.84 %.Its average ratio represented 71.02 % of total sumN-NO 3–+ N–NH 4++ N-NO 2–over the whole period(Table 2).In 2005 the average concentrations of ammoniumnitrogen fluctuated from 0.48 (February) to2.50 mg.l –1 (July) and its average concentrationwas 1.18 mg.l –1 . In 2006 the average concentrationsof N-NH 4+ranged from 0.23 (May) to 1.84mg.l –1 (August) and the average concentration represented0.81 mg.l –1 . The average concentration ofN-NH 4+was 1.0 mg.l –1 (Fig. 3, 4) over the wholemonitored period. It agrees with Dubová, Bublinec(1998) opinion who state that ammonium nitrogencreates half of N-NO 3–deposition. The detectedaverage value of ammonium nitrogen correspondswith Dubová, Bublinec results (1997) who ascertainedits average value 1.15 mg.l –1 in precipitationsin chosen localities of the protected landscape areaMuránska planina. Analogous to nitrate nitrogenthere was no seasonal regularity in N-NH 4+concentration.Fig. 3 The average concentrations of N-NH 4+(mg.l –1 )in atmospheric precipitations in 2005–2006mg.dm -33,002,502,001,501,000,500,001 2 3 4 5 6 7 8 9 10 11 12monthsyear 2005 year 2006 AverageFig. 4 The average concentrations of N-NH 4+(mg.l –1 ) in atmospheric precipitationsin each month over the years 2005–2006In 2005 the amounts of ammonium nitrogeninfiltrated into the soil ranged from 0.07 (March)to 1.48 kg.ha –1 (July) and the average amount ofN-NH 4+represented 7.47 kg.ha –1 over the wholeexperimental year. In 2006 inputs of ammoniumnitrogen by precipitations into the soil fluctuated ininterval from 0.05 (September, December) to 1.55kg.ha –1 (August) and the average amount represented4.88 kg.ha –1 (Table 1). On the average 6.18 kgof N-NH 4+.ha –1 got into the soil by precipitationsduring the whole monitored period. It correspondswith Noskovič, Gábriš results (1995) who foundout that 7.00 kg of N-NH 4+.ha –1 infiltrated into thesoil by precipitations in surroundings of Nitra.Ammonium nitrogen ratio made up 30.03 % ofthe total sum N-NO 3–+ N-NH 4++ N-NO 2–(mg.l –1 )in 2005 and in 2006 it was 23.54 %. The averagevalue was 26.78 % over both experimental years(Table 2).In 2005 concentrations of nitrite nitrogen inprecipitations fluctuated in interval from 0.03(February, April, June) to 0.17 mg.l –1 (July) andthe average value represented 0.07 mg.l –1 . In 2006
104the concentrations ranged from 0.03 (September)to 0.29 mg.l –1 (March) and the average value was0.09 mg.l –1 . Its average value per two experimentalyears represented 0.08 mg.l –1 (Fig. 5, 6). It followsthat there was no seasonal regularity of N-NO 2–concentrations.0,10mg.dm -30,350,300,250,200,150,100,050,001 2 3 4 5 6 7 8 9 10 11 12monthsmg.dm -30,080,060,040,020,002005 2006 Average 2005-2006YearsFig. 5 The average concentrations of N-NO 2–(mg.l –1 )in atmospheric precipitations in 2005–2006year 2005 year 2006 AverageFig. 6 The average concentrations of N-NO 2–(mg.l –1 )in atmospheric precipitations in each monthover the years 2005–2006Inputs of nitrite nitrogen by precipitationsinto the soil fluctuated from 0.004 (October) to0.07 kg.ha –1 (November) in the first monitoredTab. 1 Inputs of N-NO 3–, N-NH 4+and N-NO 2–(kg.ha –1 ) into the soil by precipitations 2005–2006Year 2005Months Precipitations–N-NO 3+N-NH 4–N-NO 2+ –N-NO 3–+ N-NH 4+ N-NO 2January 36.4 1.28 0.21 0.03 1.52February 58.3 1.57 0.28 0.02 1.87March 3.4 0.08 0.07 0.01 0.16April 78.7 2.02 0.89 0.02 2.93May 60.9 1.86 0.73 0.02 2.61June 31.5 0.75 0.20 0.01 0.96July 59.0 1.06 1.48 0.04 2.58August 94.5 1.80 1.03 0.06 2.89September 47.1 1.22 1.08 0.03 2.33October 12.1 0.36 0.30 0.004 0.66November 43.1 1.38 0.40 0.07 1.85December 113.2 3.71 0.80 0.04 4.55Σ 638.2 17.09 7.47 0.35 24.91Year 2006Months Precipitations–N-NO 3+N-NH 4–N-NO 2+ –N-NO 3–+ N-NH 4+ N-NO 2January 57.4 1.23 0.24 0.05 1.52February 39.0 1.54 0.41 0.02 1.97March 35.2 0.89 0.46 0.10 1.45April 48.1 1.73 1.36 0.09 3.18May 95.6 2.37 0.22 0.12 2.71June 63.9 1.66 0.18 0.03 1.87July 23.7 0.46 0.11 0.01 0.58August 84.0 1.38 1.55 0.06 2.99September 12.7 0.17 0.05 0.004 0.22October 15.3 0.34 0.09 0.006 0.44November 24.4 0.68 0.16 0.02 0.86December 7.8 0.25 0.05 0.008 0.31Σ 507.10 12.70 4.88 0.52 18.10
- Page 2 and 3:
Acta FacultatisEcologiaeJournal of
- Page 4 and 5:
OBSAH / CONTENTSISOL M., MICHALÍKO
- Page 6:
5ACTA FACULTATIS ECOLOGIAE, 16: Sup
- Page 12:
11ACTA FACULTATIS ECOLOGIAE, 16: Su
- Page 18 and 19:
17ACTA FACULTATIS ECOLOGIAE, 16: Su
- Page 20 and 21:
19are lower in ill patients compare
- Page 22:
21are considered as the most accura
- Page 25 and 26:
24- multimode cavities are usually
- Page 27 and 28:
26the load during its exposure to f
- Page 29 and 30:
28Tradescantia paludosa 02 test and
- Page 31 and 32:
30Tab. 5: Results of positive contr
- Page 34 and 35:
33ACTA FACULTATIS ECOLOGIAE, 16: Su
- Page 36 and 37:
35DISCUSSIONThe ionising radiation
- Page 38 and 39:
37ACTA FACULTATIS ECOLOGIAE, 16: Su
- Page 40 and 41:
39222Rn is produced by radioactive
- Page 42 and 43:
41180160140this reason we also pick
- Page 44:
435001450400350hKz0,8h [m]300250200
- Page 47 and 48:
46deposit is that stripped in off-l
- Page 49 and 50:
48TruenessTrueness was determined i
- Page 51 and 52:
50MATERIAL AND METHODSChloroform (p
- Page 53 and 54: 52absorbance [a.u.]1,000,750,500,25
- Page 55 and 56: 54Tab. 1: Rrequirements determinati
- Page 57 and 58: 56Methods of VOC testing were set a
- Page 60 and 61: 59Tab. 6: ContinuedSamples withsurf
- Page 62 and 63: 61ACTA FACULTATIS ECOLOGIAE, 16: Su
- Page 64 and 65: 63One of the possible explanations
- Page 66 and 67: 65Ai - Ai-1 [Bq.m -3 ]86420-2-4-6-8
- Page 68 and 69: 67ACTA FACULTATIS ECOLOGIAE, 15: Su
- Page 70 and 71: 69BiodegradabilityThe great variety
- Page 72 and 73: 71degradation starts of late days,
- Page 74 and 75: 73Fig. 4 Treated (after 28 days of
- Page 76: 75parameters of the cutting process
- Page 80 and 81: 79Fraction: D (residual rest) prese
- Page 82: 81was not confirmed. Maximum of mer
- Page 85 and 86: 84Fig. 1 Schematic diagram of atomi
- Page 87 and 88: 86Alpha spectrometryAlpha spectrome
- Page 89 and 90: 8880007000y = 6622xR 2 = 0.939SIMS
- Page 92 and 93: 91ACTA FACULTATIS ECOLOGIAE, 16: Su
- Page 94 and 95: 93Gemer according to the German mod
- Page 96 and 97: 95Tab. 1 Results of the chemical an
- Page 98 and 99: 97Continuation of Tab. 2 Results of
- Page 100 and 101: 99Vlčia Dolina and from the reserv
- Page 102 and 103: 101ACTA FACULTATIS ECOLOGIAE, 16: S
- Page 106 and 107: 105year and the average value repre
- Page 108 and 109: 107ACTA FACULTATIS ECOLOGIAE, 16: S
- Page 110 and 111: 109Sample site 1 Sample site 2 Samp
- Page 112 and 113: 111As for the sampling time (Fig. 5
- Page 114 and 115: 113ACTA FACULTATIS ECOLOGIAE, 16: S
- Page 116 and 117: 115Typha latifolia, Carex sp., Scir
- Page 118 and 119: 117conditions for decomposition of
- Page 120 and 121: 119ACTA FACULTATIS ECOLOGIAE, 16: S
- Page 122 and 123: 121from the background (derived fro
- Page 124 and 125: 12311. PETROVSKÝ, E., ELWOOD, B.:
- Page 126 and 127: 125ACTA FACULTATIS ECOLOGIAE, 16: S
- Page 128 and 129: 1272.52.0Correlation coefficient 0,
- Page 130 and 131: 129ACTA FACULTATIS ECOLOGIAE, 16: S
- Page 132 and 133: 131RESULTS AND DISCUSSIONTable 2 gi
- Page 134 and 135: 133ACTA FACULTATIS ECOLOGIAE, 16: S
- Page 136 and 137: 135V-1 BOREHOLEThe courses of 222 R
- Page 138 and 139: 137AV-2 (40m) 2006A ( 222 Rn) [kBq/
- Page 140 and 141: 139soaks into the soil, another par
- Page 142 and 143: 141ACTA FACULTATIS ECOLOGIAE, 16: S
- Page 144 and 145: 143Fig. 2 The continuous monitoring
- Page 146 and 147: 145Indoor radon activity concentrat
- Page 148 and 149: 147ACTA FACULTATIS ECOLOGIAE, 16: S
- Page 150 and 151: 149Fig. 1 Podlipa dump-fieldCanada)
- Page 152 and 153: 151concentrations of Fe. Cu. Cd. Ni
- Page 154 and 155:
153DUMP-FIELDREFERENCE SITEppm15001
- Page 156 and 157:
155Fig. 5 Compression of wood forma
- Page 158 and 159:
157decrease in the following order:
- Page 160 and 161:
159ACTA FACULTATIS ECOLOGIAE, 16: S
- Page 162 and 163:
161SPECIFIC EXAMPLES OFFACTORS THAT
- Page 164 and 165:
163ACTA FACULTATIS ECOLOGIAE, 16: S
- Page 166 and 167:
165The methods developed to incorpo
- Page 168 and 169:
167The effects of wind on ozone con
- Page 170 and 171:
169Fig. 6 Mean total and stomatal f
- Page 172 and 173:
171transport modelling in North Ame
- Page 175:
Acta Facultatis Ecologiae, Volume 1