Acta Facultatis Ecologiae - Technická univerzita vo Zvolene
Acta Facultatis Ecologiae - Technická univerzita vo Zvolene
Acta Facultatis Ecologiae - Technická univerzita vo Zvolene
- No tags were found...

Create successful ePaper yourself
Turn your PDF publications into a flip-book with our unique Google optimized e-Paper software.
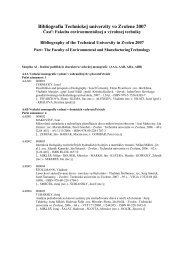
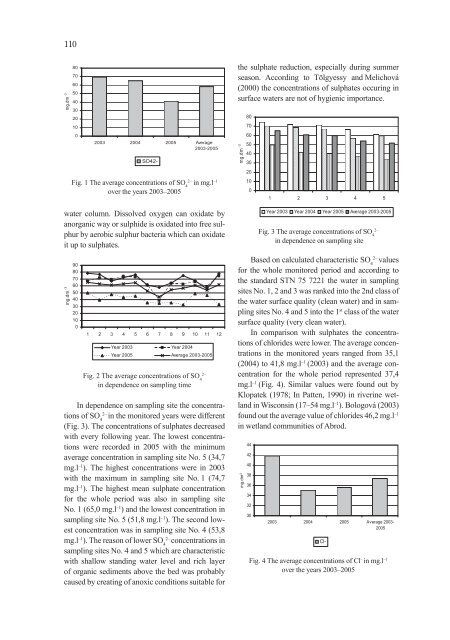
110mg.dm -3807060504030201002003 2004 2005 Average2003-2005SO42-the sulphate reduction, especially during summerseason. According to Tölgyessy and Melichová(2000) the concentrations of sulphates occuring insurface waters are not of hygienic importance.mg.dm -380706050403020Fig. 1 The average concentrations of SO 42–in mg.l –1over the years 2003–2005water column. Dissolved oxygen can oxidate byanorganic way or sulphide is oxidated into free sulphurby aerobic sulphur bacteria which can oxidateit up to sulphates.1001 2 3 4 5Year 2003 Year 2004 Year 2005 Average 2003-2005Fig. 3 The average concentrations of SO 42–in dependence on sampling sitemg.dm -390807060504030201001 2 3 4 5 6 7 8 9 10 11 12Year 2003 Year 2004Year 2005 Average 2003-2005Fig. 2 The average concentrations of SO 42–in dependence on sampling timeIn dependence on sampling site the concentrationsof SO 42–in the monitored years were different(Fig. 3). The concentrations of sulphates decreasedwith every following year. The lowest concentrationswere recorded in 2005 with the minimumaverage concentration in sampling site No. 5 (34,7mg.l –1 ). The highest concentrations were in 2003with the maximum in sampling site No. 1 (74,7mg.l –1 ). The highest mean sulphate concentrationfor the whole period was also in sampling siteNo. 1 (65,0 mg.l –1 ) and the lowest concentration insampling site No. 5 (51,8 mg.l –1 ). The second lowestconcentration was in sampling site No. 4 (53,8mg.l –1 ). The reason of lower SO 42–concentrations insampling sites No. 4 and 5 which are characteristicwith shallow standing water level and rich layerof organic sediments above the bed was probablycaused by creating of anoxic conditions suitable forBased on calculated characteristic SO 42–valuesfor the whole monitored period and according tothe standard STN 75 7221 the water in samplingsites No. 1, 2 and 3 was ranked into the 2nd class ofthe water surface quality (clean water) and in samplingsites No. 4 and 5 into the 1 st class of the watersurface quality (very clean water).In comparison with sulphates the concentrationsof chlorides were lower. The average concentrationsin the monitored years ranged from 35,1(2004) to 41,8 mg.l –1 (2003) and the average concentrationfor the whole period represented 37,4mg.l –1 (Fig. 4). Similar values were found out byKlopatek (1978; In Patten, 1990) in riverine wetlandin Wisconsin (17–54 mg.l –1 ). Bologová (2003)found out the average value of chlorides 46,2 mg.l –1in wetland communities of Abrod.mg.dm -344424038363432302003 2004 2005 Average 2003-2005Cl-Fig. 4 The average concentrations of Cl – in mg.l –1over the years 2003–2005