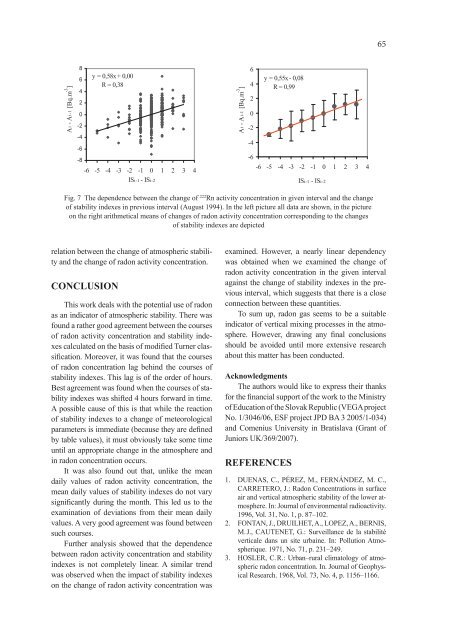
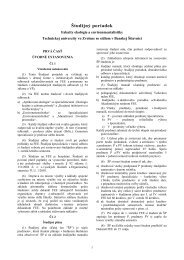
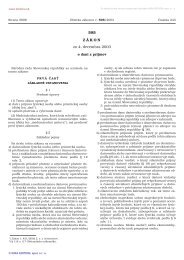
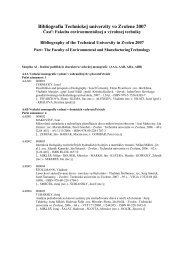
65Ai - Ai-1 [Bq.m -3 ]86420-2-4-6-8y = 0,58x + 0,00R = 0,38-6 -5 -4 -3 -2 -1 0 1 2 3 4ISi-1 - ISi-2Ai - Ai-1 [Bq.m -3 ]6420-2-4y = 0,55x - 0,08R = 0,99-6-6 -5 -4 -3 -2 -1 0 1 2 3 4ISi-1 - ISi-2Fig. 7 The dependence between the change of 222 Rn activity concentration in given interval and the changeof stability indexes in previous interval (August 1994). In the left picture all data are shown, in the pictureon the right arithmetical means of changes of radon activity concentration corresponding to the changesof stability indexes are depictedrelation between the change of atmospheric stabilityand the change of radon activity concentration.CONCLUSIONThis work deals with the potential use of radonas an indicator of atmospheric stability. There wasfound a rather good agreement between the coursesof radon activity concentration and stability indexescalculated on the basis of modified Turner classification.Moreover, it was found that the coursesof radon concentration lag behind the courses ofstability indexes. This lag is of the order of hours.Best agreement was found when the courses of stabilityindexes was shifted 4 hours forward in time.A possible cause of this is that while the reactionof stability indexes to a change of meteorologicalparameters is immediate (because they are definedby table values), it must obviously take some timeuntil an appropriate change in the atmosphere andin radon concentration occurs.It was also found out that, unlike the meandaily values of radon activity concentration, themean daily values of stability indexes do not varysignificantly during the month. This led us to theexamination of deviations from their mean dailyvalues. A very good agreement was found betweensuch courses.Further analysis showed that the dependencebetween radon activity concentration and stabilityindexes is not completely linear. A similar trendwas observed when the impact of stability indexeson the change of radon activity concentration wasexamined. However, a nearly linear dependencywas obtained when we examined the change ofradon activity concentration in the given intervalagainst the change of stability indexes in the previousinterval, which suggests that there is a closeconnection between these quantities.To sum up, radon gas seems to be a suitableindicator of vertical mixing processes in the atmosphere.However, drawing any final conclusionsshould be a<strong>vo</strong>ided until more extensive researchabout this matter has been conducted.AcknowledgmentsThe authors would like to express their thanksfor the financial support of the work to the Ministryof Education of the Slovak Republic (VEGA projectNo. 1/3046/06, ESF project JPD BA 3 2005/1-034)and Comenius University in Bratislava (Grant ofJuniors UK/369/2007).REFERENCES1. DUENAS, C., PÉREZ, M., FERNÁNDEZ, M. C.,CARRETERO, J.: Radon Concentrations in surfaceair and vertical atmospheric stability of the lower atmosphere.In: Journal of environmental radioactivity.1996, Vol. 31, No. 1, p. 87–102.2. FONTAN, J., DRUILHET, A., LOPEZ, A., BERNIS,M. J., CAUTENET, G.: Surveillance de la stabilitéverticale dans un site urbaine. In: Pollution Atmospherique.1971, No. 71, p. 231–249.3. HOSLER, C. R.: Urban–rural climatology of atmosphericradon concentration. In. Journal of GeophysicalResearch. 1968, Vol. 73, No. 4, p. 1156–1166.
664. ISRAEL, H., HORBERT, M.: Results of continuousmeasurements of radon and its decay products in thelower atmosphere. In: Tellus, 18(2–3), 638.5. BELÁŇ, T., CHUDÝ, M., ĎURANA, Ľ., GRGU-LA, M., HOLÝ, K., LEVAIOVÁ, D., POVINEC, P.,RICHTÁRIKOVÁ, M., ŠIVO, A.: Investigation ofradionuclide variations in the Bratislava air. In: PO-VINEC, P., (Ed): Rare Nuclear Processes. Proc. ofthe 14th Europhys. Conf. on Nuc. Phys. Singapore:World Scientific, 1992, 441 p.6. WARD, D. C, BORAK, T. B.: Determination of timevarying222 Rn concentrations using flow-throughscintillation flasks. In: Health Physics. 1991, 61, No.6, p. 799–807.7. GAJAR, B.: Comparison of Different AtmosphericStability Classifications. Bratislava, Department ofMeteorology, Comenius University, 1974. 65 p.8. FUJINAMI, N., ESAKA, S.: Variations in radon 222daughter concentrations in surface air with atmosphericstability. In: Journal of geophysical research.1987, Vol. 92, No. D1, p. 1041–1043.
- Page 2 and 3:
Acta FacultatisEcologiaeJournal of
- Page 4 and 5:
OBSAH / CONTENTSISOL M., MICHALÍKO
- Page 6:
5ACTA FACULTATIS ECOLOGIAE, 16: Sup
- Page 12:
11ACTA FACULTATIS ECOLOGIAE, 16: Su
- Page 18 and 19: 17ACTA FACULTATIS ECOLOGIAE, 16: Su
- Page 20 and 21: 19are lower in ill patients compare
- Page 22: 21are considered as the most accura
- Page 25 and 26: 24- multimode cavities are usually
- Page 27 and 28: 26the load during its exposure to f
- Page 29 and 30: 28Tradescantia paludosa 02 test and
- Page 31 and 32: 30Tab. 5: Results of positive contr
- Page 34 and 35: 33ACTA FACULTATIS ECOLOGIAE, 16: Su
- Page 36 and 37: 35DISCUSSIONThe ionising radiation
- Page 38 and 39: 37ACTA FACULTATIS ECOLOGIAE, 16: Su
- Page 40 and 41: 39222Rn is produced by radioactive
- Page 42 and 43: 41180160140this reason we also pick
- Page 44: 435001450400350hKz0,8h [m]300250200
- Page 47 and 48: 46deposit is that stripped in off-l
- Page 49 and 50: 48TruenessTrueness was determined i
- Page 51 and 52: 50MATERIAL AND METHODSChloroform (p
- Page 53 and 54: 52absorbance [a.u.]1,000,750,500,25
- Page 55 and 56: 54Tab. 1: Rrequirements determinati
- Page 57 and 58: 56Methods of VOC testing were set a
- Page 60 and 61: 59Tab. 6: ContinuedSamples withsurf
- Page 62 and 63: 61ACTA FACULTATIS ECOLOGIAE, 16: Su
- Page 64 and 65: 63One of the possible explanations
- Page 68 and 69: 67ACTA FACULTATIS ECOLOGIAE, 15: Su
- Page 70 and 71: 69BiodegradabilityThe great variety
- Page 72 and 73: 71degradation starts of late days,
- Page 74 and 75: 73Fig. 4 Treated (after 28 days of
- Page 76: 75parameters of the cutting process
- Page 80 and 81: 79Fraction: D (residual rest) prese
- Page 82: 81was not confirmed. Maximum of mer
- Page 85 and 86: 84Fig. 1 Schematic diagram of atomi
- Page 87 and 88: 86Alpha spectrometryAlpha spectrome
- Page 89 and 90: 8880007000y = 6622xR 2 = 0.939SIMS
- Page 92 and 93: 91ACTA FACULTATIS ECOLOGIAE, 16: Su
- Page 94 and 95: 93Gemer according to the German mod
- Page 96 and 97: 95Tab. 1 Results of the chemical an
- Page 98 and 99: 97Continuation of Tab. 2 Results of
- Page 100 and 101: 99Vlčia Dolina and from the reserv
- Page 102 and 103: 101ACTA FACULTATIS ECOLOGIAE, 16: S
- Page 104 and 105: 103mg.dm -3mg.dm -35,004,003,002,00
- Page 106 and 107: 105year and the average value repre
- Page 108 and 109: 107ACTA FACULTATIS ECOLOGIAE, 16: S
- Page 110 and 111: 109Sample site 1 Sample site 2 Samp
- Page 112 and 113: 111As for the sampling time (Fig. 5
- Page 114 and 115: 113ACTA FACULTATIS ECOLOGIAE, 16: S
- Page 116 and 117:
115Typha latifolia, Carex sp., Scir
- Page 118 and 119:
117conditions for decomposition of
- Page 120 and 121:
119ACTA FACULTATIS ECOLOGIAE, 16: S
- Page 122 and 123:
121from the background (derived fro
- Page 124 and 125:
12311. PETROVSKÝ, E., ELWOOD, B.:
- Page 126 and 127:
125ACTA FACULTATIS ECOLOGIAE, 16: S
- Page 128 and 129:
1272.52.0Correlation coefficient 0,
- Page 130 and 131:
129ACTA FACULTATIS ECOLOGIAE, 16: S
- Page 132 and 133:
131RESULTS AND DISCUSSIONTable 2 gi
- Page 134 and 135:
133ACTA FACULTATIS ECOLOGIAE, 16: S
- Page 136 and 137:
135V-1 BOREHOLEThe courses of 222 R
- Page 138 and 139:
137AV-2 (40m) 2006A ( 222 Rn) [kBq/
- Page 140 and 141:
139soaks into the soil, another par
- Page 142 and 143:
141ACTA FACULTATIS ECOLOGIAE, 16: S
- Page 144 and 145:
143Fig. 2 The continuous monitoring
- Page 146 and 147:
145Indoor radon activity concentrat
- Page 148 and 149:
147ACTA FACULTATIS ECOLOGIAE, 16: S
- Page 150 and 151:
149Fig. 1 Podlipa dump-fieldCanada)
- Page 152 and 153:
151concentrations of Fe. Cu. Cd. Ni
- Page 154 and 155:
153DUMP-FIELDREFERENCE SITEppm15001
- Page 156 and 157:
155Fig. 5 Compression of wood forma
- Page 158 and 159:
157decrease in the following order:
- Page 160 and 161:
159ACTA FACULTATIS ECOLOGIAE, 16: S
- Page 162 and 163:
161SPECIFIC EXAMPLES OFFACTORS THAT
- Page 164 and 165:
163ACTA FACULTATIS ECOLOGIAE, 16: S
- Page 166 and 167:
165The methods developed to incorpo
- Page 168 and 169:
167The effects of wind on ozone con
- Page 170 and 171:
169Fig. 6 Mean total and stomatal f
- Page 172 and 173:
171transport modelling in North Ame
- Page 175:
Acta Facultatis Ecologiae, Volume 1