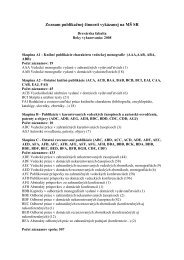
115Typha latifolia, Carex sp., Scirpus sp., etc. dominate,among two fill slopes (www.zitava.sk).Taking of water samples was realized from 6sampling sites in the NR. Water samples were takenregularly during the whole year, 15 th day ofeach month. The sampling sites were proposed toobtain the best possible data for the evaluation ofthe changes in concentrations of dissolved oxygenand organic substances in water in dependence onspace and time. We have established the followingsix sampling sites:1. Inflow of the river Žitava into the Aluvium.Phragmites australis and Salix sp. grow alongthe river Žitava and they are also typical for thewhole area of the NR. The average depth is 0.32m.2. and 3. The sampling sites are typical wetlandecosystems. There is a very dense stand ofPhragmites australis and Salix sp. in this part ofthe NR. Water level is covered by Lemna minor.Water in these sites flows very slowly and itshigh changes in dependence on weather duringthe year. The average depth is about 0,30 m.4. It is situated near the bridge on which there isa road to the village Martovce. It is also the narrowestpart of Aluvium; therefore water flowreaches the highest speed in the river Žitava.There are typical stands of Phragmites australis,Salix sp., Alnus sp. on the banks of the river. Theaverage depth is 0.40 m.5. and 6. They are characterized as typical wetlandecosystems. The river Žitava flows out of itswatershed here while rapid snow melting duringspring months and intensive precipitationamount in summer months. In comparison withthe second and the third sampling site the riverfloods the whole area between two slopes. Thewater level decreases about few meters duringdry weather in summer months. This part ofAluvium is mostly represented by an open waterarea. Typha latifolia, Phragmites australis, Alnussp. and Salix sp. grows along the river. Thewater level in the sixth sampling site is coveredwith Lemna minor which forms a typical greencover. This sampling site is situated about 120 mfrom the place where the river Žitava joins theriver Nitra. The average depth in the 5 th samplingsite is 0.26 m and 0.39 m in the 6 th samplingsite.In taken water samples the concentrationsof dissolved oxygen were determined by inoLabMulti Level 3 with galvanic oxygen sonde StirrOxG. The concentrations of organic substances weredetermined by an indirect method based on theiroxidation with dichromate potassium by means ofsolutions of Merck spectrophotometrically. Themethod is analogical with ISO 6060, EPA 410A.The results of dissolved oxygen and organic substancesconcentrations are given in mg O 2.l –1 .The water in the sampling sites was ranked inthe categories of surface water quality. It was performedby comparison of the calculated characteristicvalues of indicator and the correspondingsystem of limit values which are stated by the standardSTN 75 7221 (Classification of the surfacewater quality). According to the standard STN, thecharacteristic value of indicator is the value withthe probability of non-overfullfilment of 90 % inCOD Crand with the probability of overfullfilment90 % in dissolved oxygen.RESULTS AND DISCUSSIONFrom the results of average concentrationsof dissolved oxygen in water of the NR AluviumŽitavy in dependence on sampling time shows thatthe highest values were during winter and earlyspring months. The maximum value was meausredin March (9.0 mg O 2. l –1 ). Since April there wasa tendency of successive decrease of average concentrationsof dissolved oxygen. The minimumvalue was measured in July (1.6 mg O 2.l –1 ) (Fig. 1).This fall is probably related to successive increaseof water temperature. Thus good conditions werecreated for decomposition of organic matter by microorganismsin water in which they use dissolvedoxygen. We supposed that very low average concentrationof oxygen in July is connected with thehighest temperature of water (22 °C) measured inthis month in the NR (Fig. 2). It is known from literature(Losos et al., 1984, Pitter, 1999) that the dissolubilityof oxygen in water subsides with risingwater temperature. Beňačková, Noskovič (2005)found out similar dependence between dissolvedoxygen concentration and water temperature in theNR Žitavský luh.
116mg.dm -310,009,008,007,006,005,004,003,002,001,000,001 2 3 4 5 6 7 8 9 10 11 12MonthsO2Fig. 1 Concentrations of dissolved oxygen in mg.l –1 in dependence on sampling time°C25,020,015,010,05,00,01 2 3 4 5 6 7 8 9 10 11 12Months10,009,008,007,006,005,004,003,002,001,000,00m g.dm -3Temperature of waterDissolved oxygenFig. 2 Relation between the average temperature of water and dissolved oxygen concentrationAs for the sampling place the highest averageconcentrations of dissolved oxygen were measuredin sampling sites No. 1 (6.0 mg O 2.l –1 ) and No.4 (5.5 mg O 2.l –1 ). Sampling site No. 1 is situatedon the inflow of the river Žitava into the NatureReserve and sampling site No. 4 is situated on thenarrowest place of the NR where water flow hasthe highest speed. These sites are characterized bypermanent water flow. Lower values of dissolvedoxygen were in sampling sites No. 2, 3, 5 and 6(Fig. 3) because these sites are typical wetlandecosystems. They are overgrown by aquatic plantsand there is a huge amount of organic matter fromextinct plants in sediments thus good conditionsfor accumulation of organic substances in waterare created. Different conditions in sampling sitesNo. 2, 3, 5 and 6 were probably the reason of lowerconcentrations of dissolved oxygen compared withsampling sites No. 1 and 4 Beňačková, Noskovič(2005) and Sedláková (2004) measured low concentrationof dissolved oxygen in similar localities(the NR Žitavský luh and the NNR Parížske močiarerespectively).Based on calculated characteristic values ofdissolved oxygen and according to the standard weranked all sampling sites into the 5 th class of the watersurface quality (very strongly polluted water).Total content of organic substances in water inthe NR Alúvium Žitavy was evaluated according toCOD Crvalues. In dependence on sampling time thehighest values were determined in summer monthswith the maximum in August (129.3 mg O 2.l –1 ).Beňačková, Noskovič (2005) measured the highestvalues of COD Crin August in the NR Žitavskýluh, too. High values of COD Crin summer monthsare obviously related to intensive decomposition oforganic matter. The lowest values were measuredin winter season with the minimum in December(52.7 mg O 2.l –1 ) (Fig. 4). The fall of COD Crvaluesin winter can be connected with unsuitable thermal
- Page 2 and 3:
Acta FacultatisEcologiaeJournal of
- Page 4 and 5:
OBSAH / CONTENTSISOL M., MICHALÍKO
- Page 6:
5ACTA FACULTATIS ECOLOGIAE, 16: Sup
- Page 12:
11ACTA FACULTATIS ECOLOGIAE, 16: Su
- Page 18 and 19:
17ACTA FACULTATIS ECOLOGIAE, 16: Su
- Page 20 and 21:
19are lower in ill patients compare
- Page 22:
21are considered as the most accura
- Page 25 and 26:
24- multimode cavities are usually
- Page 27 and 28:
26the load during its exposure to f
- Page 29 and 30:
28Tradescantia paludosa 02 test and
- Page 31 and 32:
30Tab. 5: Results of positive contr
- Page 34 and 35:
33ACTA FACULTATIS ECOLOGIAE, 16: Su
- Page 36 and 37:
35DISCUSSIONThe ionising radiation
- Page 38 and 39:
37ACTA FACULTATIS ECOLOGIAE, 16: Su
- Page 40 and 41:
39222Rn is produced by radioactive
- Page 42 and 43:
41180160140this reason we also pick
- Page 44:
435001450400350hKz0,8h [m]300250200
- Page 47 and 48:
46deposit is that stripped in off-l
- Page 49 and 50:
48TruenessTrueness was determined i
- Page 51 and 52:
50MATERIAL AND METHODSChloroform (p
- Page 53 and 54:
52absorbance [a.u.]1,000,750,500,25
- Page 55 and 56:
54Tab. 1: Rrequirements determinati
- Page 57 and 58:
56Methods of VOC testing were set a
- Page 60 and 61:
59Tab. 6: ContinuedSamples withsurf
- Page 62 and 63:
61ACTA FACULTATIS ECOLOGIAE, 16: Su
- Page 64 and 65:
63One of the possible explanations
- Page 66 and 67: 65Ai - Ai-1 [Bq.m -3 ]86420-2-4-6-8
- Page 68 and 69: 67ACTA FACULTATIS ECOLOGIAE, 15: Su
- Page 70 and 71: 69BiodegradabilityThe great variety
- Page 72 and 73: 71degradation starts of late days,
- Page 74 and 75: 73Fig. 4 Treated (after 28 days of
- Page 76: 75parameters of the cutting process
- Page 80 and 81: 79Fraction: D (residual rest) prese
- Page 82: 81was not confirmed. Maximum of mer
- Page 85 and 86: 84Fig. 1 Schematic diagram of atomi
- Page 87 and 88: 86Alpha spectrometryAlpha spectrome
- Page 89 and 90: 8880007000y = 6622xR 2 = 0.939SIMS
- Page 92 and 93: 91ACTA FACULTATIS ECOLOGIAE, 16: Su
- Page 94 and 95: 93Gemer according to the German mod
- Page 96 and 97: 95Tab. 1 Results of the chemical an
- Page 98 and 99: 97Continuation of Tab. 2 Results of
- Page 100 and 101: 99Vlčia Dolina and from the reserv
- Page 102 and 103: 101ACTA FACULTATIS ECOLOGIAE, 16: S
- Page 104 and 105: 103mg.dm -3mg.dm -35,004,003,002,00
- Page 106 and 107: 105year and the average value repre
- Page 108 and 109: 107ACTA FACULTATIS ECOLOGIAE, 16: S
- Page 110 and 111: 109Sample site 1 Sample site 2 Samp
- Page 112 and 113: 111As for the sampling time (Fig. 5
- Page 114 and 115: 113ACTA FACULTATIS ECOLOGIAE, 16: S
- Page 118 and 119: 117conditions for decomposition of
- Page 120 and 121: 119ACTA FACULTATIS ECOLOGIAE, 16: S
- Page 122 and 123: 121from the background (derived fro
- Page 124 and 125: 12311. PETROVSKÝ, E., ELWOOD, B.:
- Page 126 and 127: 125ACTA FACULTATIS ECOLOGIAE, 16: S
- Page 128 and 129: 1272.52.0Correlation coefficient 0,
- Page 130 and 131: 129ACTA FACULTATIS ECOLOGIAE, 16: S
- Page 132 and 133: 131RESULTS AND DISCUSSIONTable 2 gi
- Page 134 and 135: 133ACTA FACULTATIS ECOLOGIAE, 16: S
- Page 136 and 137: 135V-1 BOREHOLEThe courses of 222 R
- Page 138 and 139: 137AV-2 (40m) 2006A ( 222 Rn) [kBq/
- Page 140 and 141: 139soaks into the soil, another par
- Page 142 and 143: 141ACTA FACULTATIS ECOLOGIAE, 16: S
- Page 144 and 145: 143Fig. 2 The continuous monitoring
- Page 146 and 147: 145Indoor radon activity concentrat
- Page 148 and 149: 147ACTA FACULTATIS ECOLOGIAE, 16: S
- Page 150 and 151: 149Fig. 1 Podlipa dump-fieldCanada)
- Page 152 and 153: 151concentrations of Fe. Cu. Cd. Ni
- Page 154 and 155: 153DUMP-FIELDREFERENCE SITEppm15001
- Page 156 and 157: 155Fig. 5 Compression of wood forma
- Page 158 and 159: 157decrease in the following order:
- Page 160 and 161: 159ACTA FACULTATIS ECOLOGIAE, 16: S
- Page 162 and 163: 161SPECIFIC EXAMPLES OFFACTORS THAT
- Page 164 and 165: 163ACTA FACULTATIS ECOLOGIAE, 16: S
- Page 166 and 167:
165The methods developed to incorpo
- Page 168 and 169:
167The effects of wind on ozone con
- Page 170 and 171:
169Fig. 6 Mean total and stomatal f
- Page 172 and 173:
171transport modelling in North Ame
- Page 175:
Acta Facultatis Ecologiae, Volume 1