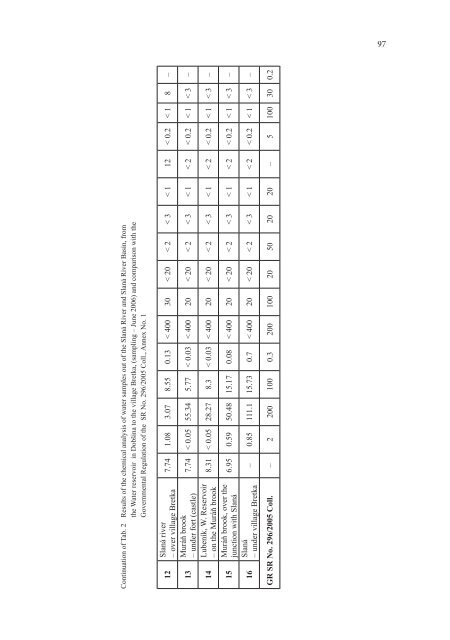
97Continuation of Tab. 2 Results of the chemical analysis of water samples out of the Slaná River and Slaná River Basin, fromthe Water reser<strong>vo</strong>ir in Dobšina to the village Bretka, (sampling – June 2006) and comparison with theGovernmental Regulation of the SR No. 296/2005 Coll., Annex No. 11213141516Slaná river– over village Bretka7.74 1.08 3.07 8.55 0.13 < 400 30 < 20 < 2 < 3 < 1 12 < 0.2 < 1 8 –Muráň brook– under fort (castle)7.74 < 0.05 55.34 5.77 < 0.03 < 400 20 < 20 < 2 < 3 < 1 < 2 < 0.2 < 1 < 3 –Lubeník, W. Reser<strong>vo</strong>ir– on the Muráň brook8.31 < 0.05 28.27 8.3 < 0.03 < 400 20 < 20 < 2 < 3 < 1 < 2 < 0.2 < 1 < 3 –Muráň brook, over thejunction with Slaná6.95 0.59 50.48 15.17 0.08 < 400 20 < 20 < 2 < 3 < 1 < 2 < 0.2 < 1 < 3 –Slaná– under village Bretka– 0.85 111.1 15.73 0.7 < 400 20 < 20 < 2 < 3 < 1 < 2 < 0.2 < 1 < 3 –GR SR No. 296/2005 Coll. – 2 200 100 0.3 200 100 20 50 20 20 – 5 100 30 0.2
98water in the water reser<strong>vo</strong>ir of WW PalcmanskáMaša (4).Sediment loadResults of analyses of the samples of sedimentload (bottom sediments) procured from the streamsin the basin of the River Slaná, WW Vlčia Dolina,the water reser<strong>vo</strong>ir in or better under Dobšiná town,as well as from the places of outflows from sludgebeds, shafts and drifts in this basin are containedin Tab. 3 and 4. The values gained by the analysiswere compared with the standard being the MethodologicalInstruction of the Ministry of the Environmentof the Slovak Republic No. 549/98-2 (5).Tab. 3 contains results of the chemical analysisof samples of deposits taken in April from threelocalities. Each of the localities is specific in termsof the basin of the River Slaná. The sediment loadfrom the brook bottom in Vlčia Dolina before itflows to the reser<strong>vo</strong>ir of WW Vlčia Dolina reflectsthe impact of relics of old mining, processing andiron–making activities in the remote past on bothbanks of this brook. Out of 10 selected elementsfor which the standard used has 3 limit values thecontents of 5 elements – Pb, Sb, Cd, As and Hg– do not reach the maximum testing value (TV),the contents of 3 elements – Zn, Cu and Co – exceedthe TV limit, but do not reach the maximumpermitted concentration (MPC). The contents of2 elements – Ni and Cr – significantly exceed theMPC as well as the intervention value (IV) showingthat the content of the element is according tothe standard used undesirable and correcting themeasures are needed.The contents of the elements in the sedimentload from the bottom of the water reser<strong>vo</strong>ir in Dobšináserving as the balancing reser<strong>vo</strong>ir for the reser<strong>vo</strong>irof WW Vlčia Dolina is very similar to the onefrom the deposits from the brook bottom in VlčiaDolina. Out of 10 selected elements the contentsof 3 elements – Pb, Sb and As – in the sample donot reach the testing value (TV), the content of 7elements – Zn, Cu, Co, Ni, Cd, Cr and Hg – in thesample exceed the TV to different extents, but thecontents of 3 elements – Cu, Ni and Cr – in thesample exceed also the MPC and the elements Niand Cr also the IV.The sample from the locality of the left toe drainof the sludge basin of Nižná Slaná has a similarcontent of the selected elements as the precedingtwo localities. The contents of 4 elements – Zn,Co, Pb and Cd – in the sample do not reach the TV,whereas Cu and Hg exceed it significantly. However,the contents of 4 elements – Ni, Sb, Cr and As– significantly exceed all 3 limit values (TV, MPCand IV).The contents of heavy metals in the sedimentload (sediments) from the locality – left toe drain ofthe sludge bed of Nižná Slaná – from the basin inTab. 3 Results of the chemical analysis of sediment load samples in the Slaná River Basin, from Vlčia Dolina – brookto Nižná Slaná, (sampling – April 2006) and comparison with the Methodical Instruction of the ME the SR No.549/1998-2No. ofsample136LOCALITYMI ME SRNo. 549/ 1998-2Vlčia Dolina– brookW. Reser<strong>vo</strong>ir– in DobšináSludge basinNižná Slaná– left toe drainZn Cu Mn Co Ni Pb Sb Cd Cr As Hg[mg . kg –1 ]141.5 51.9 1 000 12.3 650.9 28.3
- Page 2 and 3:
Acta FacultatisEcologiaeJournal of
- Page 4 and 5:
OBSAH / CONTENTSISOL M., MICHALÍKO
- Page 6:
5ACTA FACULTATIS ECOLOGIAE, 16: Sup
- Page 12:
11ACTA FACULTATIS ECOLOGIAE, 16: Su
- Page 18 and 19:
17ACTA FACULTATIS ECOLOGIAE, 16: Su
- Page 20 and 21:
19are lower in ill patients compare
- Page 22:
21are considered as the most accura
- Page 25 and 26:
24- multimode cavities are usually
- Page 27 and 28:
26the load during its exposure to f
- Page 29 and 30:
28Tradescantia paludosa 02 test and
- Page 31 and 32:
30Tab. 5: Results of positive contr
- Page 34 and 35:
33ACTA FACULTATIS ECOLOGIAE, 16: Su
- Page 36 and 37:
35DISCUSSIONThe ionising radiation
- Page 38 and 39:
37ACTA FACULTATIS ECOLOGIAE, 16: Su
- Page 40 and 41:
39222Rn is produced by radioactive
- Page 42 and 43:
41180160140this reason we also pick
- Page 44:
435001450400350hKz0,8h [m]300250200
- Page 47 and 48: 46deposit is that stripped in off-l
- Page 49 and 50: 48TruenessTrueness was determined i
- Page 51 and 52: 50MATERIAL AND METHODSChloroform (p
- Page 53 and 54: 52absorbance [a.u.]1,000,750,500,25
- Page 55 and 56: 54Tab. 1: Rrequirements determinati
- Page 57 and 58: 56Methods of VOC testing were set a
- Page 60 and 61: 59Tab. 6: ContinuedSamples withsurf
- Page 62 and 63: 61ACTA FACULTATIS ECOLOGIAE, 16: Su
- Page 64 and 65: 63One of the possible explanations
- Page 66 and 67: 65Ai - Ai-1 [Bq.m -3 ]86420-2-4-6-8
- Page 68 and 69: 67ACTA FACULTATIS ECOLOGIAE, 15: Su
- Page 70 and 71: 69BiodegradabilityThe great variety
- Page 72 and 73: 71degradation starts of late days,
- Page 74 and 75: 73Fig. 4 Treated (after 28 days of
- Page 76: 75parameters of the cutting process
- Page 80 and 81: 79Fraction: D (residual rest) prese
- Page 82: 81was not confirmed. Maximum of mer
- Page 85 and 86: 84Fig. 1 Schematic diagram of atomi
- Page 87 and 88: 86Alpha spectrometryAlpha spectrome
- Page 89 and 90: 8880007000y = 6622xR 2 = 0.939SIMS
- Page 92 and 93: 91ACTA FACULTATIS ECOLOGIAE, 16: Su
- Page 94 and 95: 93Gemer according to the German mod
- Page 96 and 97: 95Tab. 1 Results of the chemical an
- Page 100 and 101: 99Vlčia Dolina and from the reserv
- Page 102 and 103: 101ACTA FACULTATIS ECOLOGIAE, 16: S
- Page 104 and 105: 103mg.dm -3mg.dm -35,004,003,002,00
- Page 106 and 107: 105year and the average value repre
- Page 108 and 109: 107ACTA FACULTATIS ECOLOGIAE, 16: S
- Page 110 and 111: 109Sample site 1 Sample site 2 Samp
- Page 112 and 113: 111As for the sampling time (Fig. 5
- Page 114 and 115: 113ACTA FACULTATIS ECOLOGIAE, 16: S
- Page 116 and 117: 115Typha latifolia, Carex sp., Scir
- Page 118 and 119: 117conditions for decomposition of
- Page 120 and 121: 119ACTA FACULTATIS ECOLOGIAE, 16: S
- Page 122 and 123: 121from the background (derived fro
- Page 124 and 125: 12311. PETROVSKÝ, E., ELWOOD, B.:
- Page 126 and 127: 125ACTA FACULTATIS ECOLOGIAE, 16: S
- Page 128 and 129: 1272.52.0Correlation coefficient 0,
- Page 130 and 131: 129ACTA FACULTATIS ECOLOGIAE, 16: S
- Page 132 and 133: 131RESULTS AND DISCUSSIONTable 2 gi
- Page 134 and 135: 133ACTA FACULTATIS ECOLOGIAE, 16: S
- Page 136 and 137: 135V-1 BOREHOLEThe courses of 222 R
- Page 138 and 139: 137AV-2 (40m) 2006A ( 222 Rn) [kBq/
- Page 140 and 141: 139soaks into the soil, another par
- Page 142 and 143: 141ACTA FACULTATIS ECOLOGIAE, 16: S
- Page 144 and 145: 143Fig. 2 The continuous monitoring
- Page 146 and 147: 145Indoor radon activity concentrat
- Page 148 and 149:
147ACTA FACULTATIS ECOLOGIAE, 16: S
- Page 150 and 151:
149Fig. 1 Podlipa dump-fieldCanada)
- Page 152 and 153:
151concentrations of Fe. Cu. Cd. Ni
- Page 154 and 155:
153DUMP-FIELDREFERENCE SITEppm15001
- Page 156 and 157:
155Fig. 5 Compression of wood forma
- Page 158 and 159:
157decrease in the following order:
- Page 160 and 161:
159ACTA FACULTATIS ECOLOGIAE, 16: S
- Page 162 and 163:
161SPECIFIC EXAMPLES OFFACTORS THAT
- Page 164 and 165:
163ACTA FACULTATIS ECOLOGIAE, 16: S
- Page 166 and 167:
165The methods developed to incorpo
- Page 168 and 169:
167The effects of wind on ozone con
- Page 170 and 171:
169Fig. 6 Mean total and stomatal f
- Page 172 and 173:
171transport modelling in North Ame
- Page 175:
Acta Facultatis Ecologiae, Volume 1