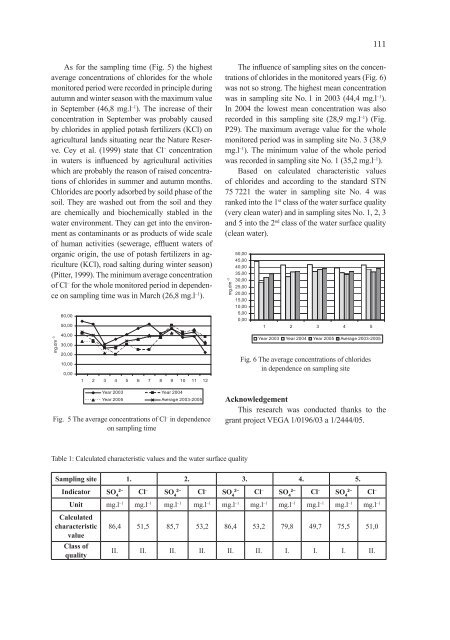
111As for the sampling time (Fig. 5) the highestaverage concentrations of chlorides for the wholemonitored period were recorded in principle duringautumn and winter season with the maximum valuein September (46,8 mg.l –1 ). The increase of theirconcentration in September was probably causedby chlorides in applied potash fertilizers (KCl) onagricultural lands situating near the Nature Reserve.Cey et al. (1999) state that Cl – concentrationin waters is influenced by agricultural activitieswhich are probably the reason of raised concentrationsof chlorides in summer and autumn months.Chlorides are poorly adsorbed by soild phase of thesoil. They are washed out from the soil and theyare chemically and biochemically stabled in thewater environment. They can get into the environmentas contaminants or as products of wide scaleof human activities (sewerage, effluent waters oforganic origin, the use of potash fertilizers in agriculture(KCl), road salting during winter season)(Pitter, 1999). The minimum average concentrationof Cl – for the whole monitored period in dependenceon sampling time was in March (26,8 mg.l –1 ).60,0050,00The influence of sampling sites on the concentrationsof chlorides in the monitored years (Fig. 6)was not so strong. The highest mean concentrationwas in sampling site No. 1 in 2003 (44,4 mg.l –1 ).In 2004 the lowest mean concentration was alsorecorded in this sampling site (28,9 mg.l –1 ) (Fig.P29). The maximum average value for the wholemonitored period was in sampling site No. 3 (38,9mg.l –1 ). The minimum value of the whole periodwas recorded in sampling site No. 1 (35,2 mg.l –1 ).Based on calculated characteristic valuesof chlorides and according to the standard STN75 7221 the water in sampling site No. 4 wasranked into the 1 st class of the water surface quality(very clean water) and in sampling sites No. 1, 2, 3and 5 into the 2 nd class of the water surface quality(clean water).mg.dm -350,0045,0040,0035,0030,0025,0020,0015,0010,005,000,001 2 3 4 5mg.dm -340,0030,0020,0010,000,001 2 3 4 5 6 7 8 9 10 11 12Year 2003 Year 2004 Year 2005 Average 2003-2005Fig. 6 The average concentrations of chloridesin dependence on sampling siteYear 2003 Year 2004Year 2005 Average 2003-2005Fig. 5 The average concentrations of Cl – in dependenceon sampling timeAcknowledgementThis research was conducted thanks to thegrant project VEGA 1/0196/03 a 1/2444/05.Table 1: Calculated characteristic values and the water surface qualitySampling site 1. 2. 3. 4. 5.2–Indicator SO 4Cl – 2–SO 4Cl – 2–SO 4Cl – 2–SO 4Cl – 2–SO 4Cl –Unit mg.l –1 mg.l –1 mg.l –1 mg.l –1 mg.l –1 mg.l –1 mg.l –1 mg.l –1 mg.l –1 mg.l –1CalculatedcharacteristicvalueClass ofquality86,4 51,5 85,7 53,2 86,4 53,2 79,8 49,7 75,5 51,0II. II. II. II. II. II. I. I. I. II.
112REFERENCES1. BEŇAČKOVÁ, J. 2007. Monitorovanie a hodnoteniekvality <strong>vo</strong>dy v Prírodnej rezervácii Žitavský luhz ekologického hľadiska. Dizertačná práca. SPU Nitra,2007, s. 212.2. BOLOGOVÁ, M., 2003. Biodiverzita Abrodu, stav,zmeny a obnova. In: Stanová, V., Viceníková, A.,2003: Biodiversity of Abrod – State, Changes andRestoration. DAPHNE – Institute of Applied Ecology,Bratislava. ISBN 80-89133-0-0.3. CEY, E. E., RUDOLPH, D. L., ARAVENA, R.,PARKIN, G. W., 1999. Role of the riparian zone incontrolling the distribution and fate of agriculturalnitrogen near a small stream in souttern Ontario. In:Journal of Contaminant Hydrology, <strong>vo</strong>l. 37, 1999, n.1–2, p. 45–67, ISSN 0169-7722.4. GÁBRIŠ, Ľ., NOSKOVIČ, J. 1988. Ná<strong>vo</strong>dy na cvičeniaz ochrany ži<strong>vo</strong>tného prostredia. 2. prepracovanévydanie. Nitra : Vysoká škola poľnohospodárska,1988, 96 s.5. PITTER, P., 1990. Hydrochemie. Praha : SNTL, 1990,568 s. ISBN 80-03-00525-6.6. PITTER, P., 1999. Hydrochemie. 2. vyd. Praha :VŠCHT, 1999, 568 s. ISBN 80-7080-340-1.7. POLANSKI, A., SMULIKOWSKI, K., 1978. Geochémia.Bratislava: SPN, 1978, 607 s.8. KLOPATEK, K., 1978. In: Patten, B. C. 1990. Wetlandsand shallow continental water bodies. In: SPBAcademic Publishing bv, 1990, <strong>vo</strong>l. 1, 759 pp. ISBN90-5103-046-0.9. LELLÁK, J., KUBÍČEK, F., 1992. Hydrobiologie.Praha : Univerzita Karlova, Karolinum, 1992, 257 s.ISBN 80-7066-530-0.10. TÖLGYESSY, J., RUŽIČKA, I. – HARANGOZÓ,M., 1997. Ekochémia. Banská Bystrica : UMB, 1997,114 s. ISBN 80-8055-023-9.11. TÖLGYESSY, J., MELICHOVÁ, Z., 2000. Chémia<strong>vo</strong>dy (Voda a jej ochrana). Banská Bystrica : UMB,2000, s. 154 ISBN 80-8055-293-2.
- Page 2 and 3:
Acta FacultatisEcologiaeJournal of
- Page 4 and 5:
OBSAH / CONTENTSISOL M., MICHALÍKO
- Page 6:
5ACTA FACULTATIS ECOLOGIAE, 16: Sup
- Page 12:
11ACTA FACULTATIS ECOLOGIAE, 16: Su
- Page 18 and 19:
17ACTA FACULTATIS ECOLOGIAE, 16: Su
- Page 20 and 21:
19are lower in ill patients compare
- Page 22:
21are considered as the most accura
- Page 25 and 26:
24- multimode cavities are usually
- Page 27 and 28:
26the load during its exposure to f
- Page 29 and 30:
28Tradescantia paludosa 02 test and
- Page 31 and 32:
30Tab. 5: Results of positive contr
- Page 34 and 35:
33ACTA FACULTATIS ECOLOGIAE, 16: Su
- Page 36 and 37:
35DISCUSSIONThe ionising radiation
- Page 38 and 39:
37ACTA FACULTATIS ECOLOGIAE, 16: Su
- Page 40 and 41:
39222Rn is produced by radioactive
- Page 42 and 43:
41180160140this reason we also pick
- Page 44:
435001450400350hKz0,8h [m]300250200
- Page 47 and 48:
46deposit is that stripped in off-l
- Page 49 and 50:
48TruenessTrueness was determined i
- Page 51 and 52:
50MATERIAL AND METHODSChloroform (p
- Page 53 and 54:
52absorbance [a.u.]1,000,750,500,25
- Page 55 and 56:
54Tab. 1: Rrequirements determinati
- Page 57 and 58:
56Methods of VOC testing were set a
- Page 60 and 61:
59Tab. 6: ContinuedSamples withsurf
- Page 62 and 63: 61ACTA FACULTATIS ECOLOGIAE, 16: Su
- Page 64 and 65: 63One of the possible explanations
- Page 66 and 67: 65Ai - Ai-1 [Bq.m -3 ]86420-2-4-6-8
- Page 68 and 69: 67ACTA FACULTATIS ECOLOGIAE, 15: Su
- Page 70 and 71: 69BiodegradabilityThe great variety
- Page 72 and 73: 71degradation starts of late days,
- Page 74 and 75: 73Fig. 4 Treated (after 28 days of
- Page 76: 75parameters of the cutting process
- Page 80 and 81: 79Fraction: D (residual rest) prese
- Page 82: 81was not confirmed. Maximum of mer
- Page 85 and 86: 84Fig. 1 Schematic diagram of atomi
- Page 87 and 88: 86Alpha spectrometryAlpha spectrome
- Page 89 and 90: 8880007000y = 6622xR 2 = 0.939SIMS
- Page 92 and 93: 91ACTA FACULTATIS ECOLOGIAE, 16: Su
- Page 94 and 95: 93Gemer according to the German mod
- Page 96 and 97: 95Tab. 1 Results of the chemical an
- Page 98 and 99: 97Continuation of Tab. 2 Results of
- Page 100 and 101: 99Vlčia Dolina and from the reserv
- Page 102 and 103: 101ACTA FACULTATIS ECOLOGIAE, 16: S
- Page 104 and 105: 103mg.dm -3mg.dm -35,004,003,002,00
- Page 106 and 107: 105year and the average value repre
- Page 108 and 109: 107ACTA FACULTATIS ECOLOGIAE, 16: S
- Page 110 and 111: 109Sample site 1 Sample site 2 Samp
- Page 114 and 115: 113ACTA FACULTATIS ECOLOGIAE, 16: S
- Page 116 and 117: 115Typha latifolia, Carex sp., Scir
- Page 118 and 119: 117conditions for decomposition of
- Page 120 and 121: 119ACTA FACULTATIS ECOLOGIAE, 16: S
- Page 122 and 123: 121from the background (derived fro
- Page 124 and 125: 12311. PETROVSKÝ, E., ELWOOD, B.:
- Page 126 and 127: 125ACTA FACULTATIS ECOLOGIAE, 16: S
- Page 128 and 129: 1272.52.0Correlation coefficient 0,
- Page 130 and 131: 129ACTA FACULTATIS ECOLOGIAE, 16: S
- Page 132 and 133: 131RESULTS AND DISCUSSIONTable 2 gi
- Page 134 and 135: 133ACTA FACULTATIS ECOLOGIAE, 16: S
- Page 136 and 137: 135V-1 BOREHOLEThe courses of 222 R
- Page 138 and 139: 137AV-2 (40m) 2006A ( 222 Rn) [kBq/
- Page 140 and 141: 139soaks into the soil, another par
- Page 142 and 143: 141ACTA FACULTATIS ECOLOGIAE, 16: S
- Page 144 and 145: 143Fig. 2 The continuous monitoring
- Page 146 and 147: 145Indoor radon activity concentrat
- Page 148 and 149: 147ACTA FACULTATIS ECOLOGIAE, 16: S
- Page 150 and 151: 149Fig. 1 Podlipa dump-fieldCanada)
- Page 152 and 153: 151concentrations of Fe. Cu. Cd. Ni
- Page 154 and 155: 153DUMP-FIELDREFERENCE SITEppm15001
- Page 156 and 157: 155Fig. 5 Compression of wood forma
- Page 158 and 159: 157decrease in the following order:
- Page 160 and 161: 159ACTA FACULTATIS ECOLOGIAE, 16: S
- Page 162 and 163:
161SPECIFIC EXAMPLES OFFACTORS THAT
- Page 164 and 165:
163ACTA FACULTATIS ECOLOGIAE, 16: S
- Page 166 and 167:
165The methods developed to incorpo
- Page 168 and 169:
167The effects of wind on ozone con
- Page 170 and 171:
169Fig. 6 Mean total and stomatal f
- Page 172 and 173:
171transport modelling in North Ame
- Page 175:
Acta Facultatis Ecologiae, Volume 1


