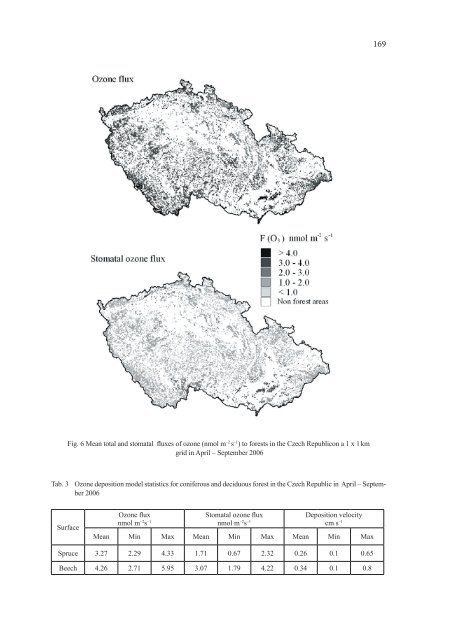
169Fig. 6 Mean total and stomatal fluxes of ozone (nmol m –2 s –1 ) to forests in the Czech Republicon a 1 x 1 kmgrid in April – September 2006Tab. 3 Ozone deposition model statistics for coniferous and deciduous forest in the Czech Republic in April – September2006SurfaceOzone fluxnmol m –2 s –1Stomatal ozone fluxnmol m –2 s –1Deposition velocitycm s –1Mean Min Max Mean Min Max Mean Min MaxSpruce 3.27 2.29 4.33 1.71 0.67 2.32 0.26 0.1 0.65Beech 4.26 2.71 5.95 3.07 1.79 4.22 0.34 0.1 0.8
170Tab. 4 Comparison of observed and modelled dry-deposition velocities (cm s –1 )SurfaceObservationModel calculation for Czech RepublicMean Range Reference Condition Mean Range ConditionSpruce 0–0.7 [23] June 0.26 0.1–0.6 April – SeptemberBeech 0.4 0.1–0.7 [24] April – May 0.34 0.1–0.75 April – September4. CONCLUSIONSThis study describes the modelling of ozoneconcentrations and deposition to a coniferous anddeciduous forest on 1 x 1 km for the territory of theCzech Republic. The deposition has been assessedfrom the measured and modelled concentrations ofozone in the atmosphere.The effects of boundary layer stability werequantified using the observed relationship betweenthe diurnal variability of surface ozone concentrationand altitude. Climatic conditions in higheraltitudes differ from those in lower altitudes. Thelocations in higher altitudes are more exposed toground ozone and are less affected by night inversionconditions. Thus the concentration values ofground ozone in the open grow up with an increasingaltitude of mountain areas of the Czech Republic.It seems clear that patterns of ozone concentrationand pattern of ozone deposition are different.The difference between ozone concentrations andozone deposition is largely due to the fact that inthe central Europe, the meteorological conditionsfa<strong>vo</strong>ur ozone formations (high temperatures andhigh vapour-pressure deficits) tend to inhibit stomatalconductance and hence uptake.AcknowledgementThis study was funded by the Ministry of Environmentof the Czech Republic.REFERENCES1. KRAUSE, G. H. M., KÖLLNER, B. and GRÜNHA-GE, L.: 2003, ´Effects of Ozone on European ForestTrees Species – A Concept of Local Risk Evaluationwithin ICP– Forests´, in P.E. Karlsson, G. Selldénand H. Pleijel (eds.), Establishing Ozone CriticalLevels II, UNECE Workshop Report, IVL report B1523, IVL Swedish Environmental Research Institute,Gothenburg, Sweden, pp. 230–235.2. FUHRER, J. and ACHERMAN, B. (eds.): 1994,´Critical Levels for Ozone´, A UN ECE workshopreport, Schriftenreiche der FAC No.16, Bern-Liebefeld.3. EMBERSON, L. D., SIMPSON, D., TUOVINEN,J.–P., ASHMORE, M.R. and CAMBRIDGE, H.M.:2000, ´Towards a Model of Ozone Deposition andStomatal Uptake over Europe´, EMEP MSC-W Note6/2000, 1–57.4. EMBERSON L. D., ASHMORE M. R., CAM-BRIDGE H., SIMPSON D. and TUOVINEN J.–P.:2000a, ´Modelling ozone flux across Europe´, EnvironmentalPollution. 109, 403–412.5. EMBERSON L. D., ASHMORE M. R., SIMPSOND., TUOVINEN J.-P. AND CAMBRIDGE H.: 2001,´Modelling and mapping ozone deposition in Europe´,Water, Air, and Soil Pollution 130, 577–582.6. ZAPLETAL, M.: 1999, ´Vztah mezi imisními koncentracemia depozičním tokem přízemního ozonudo lesní vegetace´, Ochrana ovzduší, 11(1999), 4–8.(in Czech)7. ZAPLETAL, M., CHROUST, P.: 2007. ´Ozone Depositionto a Coniferous and Deciduous Forest in theCzech Republic´. Water, Air, & Soil Pollution: Focus(2007) 7:187–200, DOI 10.2007/s11267-006-9079-5.8. ZAPLETAL, M., CHROUST, P.: 2007. ´Ozone Depositionto a Coniferous and Deciduous Forest in theCzech Republic´. In: Brimblecombe, P., Hara, H.,Houle, D., Novak, M. (Eds.), Acid Rain – Depositionto Recovery, Springer, Dordrecht, The Netherlands,2007.9. CHMI: 2006, ´Aktuální stav ovzduší. Automatizovanýimisní monitoring´, Czech HydrometeorologicalInstitute, Prague, www.chmi.cz10. PORG: 1997, ´Ozone in the United Kingdom 1997´,Fourth Report of the United Kingdom PhotochemicalOxidants Review Group, Department of the Environment,London.11. COYLE, M., SMITH, R. I., STEDMAN, J. R.,WESTON, K. J. and FOWLER, D.: 2002, ´Quantifyingthe spatial distribution of surface ozone concentrationin the UK´, Atmospheric Environment 36,1013–1024.12. Golden Software: 1999, ´Surfer. User´s Guide. Contouringand 3D Surface Mapping for Scientists andEngineers´, Golden Software, Inc, Colorado, USA.13. VOLDNER, E. C., BARRIE, L. A. and SIROIS, A.:1986, ´A literature review of dry deposition of oxidesof sulphur and nitrogen with emphasis on long-range
- Page 2 and 3:
Acta FacultatisEcologiaeJournal of
- Page 4 and 5:
OBSAH / CONTENTSISOL M., MICHALÍKO
- Page 6:
5ACTA FACULTATIS ECOLOGIAE, 16: Sup
- Page 12:
11ACTA FACULTATIS ECOLOGIAE, 16: Su
- Page 18 and 19:
17ACTA FACULTATIS ECOLOGIAE, 16: Su
- Page 20 and 21:
19are lower in ill patients compare
- Page 22:
21are considered as the most accura
- Page 25 and 26:
24- multimode cavities are usually
- Page 27 and 28:
26the load during its exposure to f
- Page 29 and 30:
28Tradescantia paludosa 02 test and
- Page 31 and 32:
30Tab. 5: Results of positive contr
- Page 34 and 35:
33ACTA FACULTATIS ECOLOGIAE, 16: Su
- Page 36 and 37:
35DISCUSSIONThe ionising radiation
- Page 38 and 39:
37ACTA FACULTATIS ECOLOGIAE, 16: Su
- Page 40 and 41:
39222Rn is produced by radioactive
- Page 42 and 43:
41180160140this reason we also pick
- Page 44:
435001450400350hKz0,8h [m]300250200
- Page 47 and 48:
46deposit is that stripped in off-l
- Page 49 and 50:
48TruenessTrueness was determined i
- Page 51 and 52:
50MATERIAL AND METHODSChloroform (p
- Page 53 and 54:
52absorbance [a.u.]1,000,750,500,25
- Page 55 and 56:
54Tab. 1: Rrequirements determinati
- Page 57 and 58:
56Methods of VOC testing were set a
- Page 60 and 61:
59Tab. 6: ContinuedSamples withsurf
- Page 62 and 63:
61ACTA FACULTATIS ECOLOGIAE, 16: Su
- Page 64 and 65:
63One of the possible explanations
- Page 66 and 67:
65Ai - Ai-1 [Bq.m -3 ]86420-2-4-6-8
- Page 68 and 69:
67ACTA FACULTATIS ECOLOGIAE, 15: Su
- Page 70 and 71:
69BiodegradabilityThe great variety
- Page 72 and 73:
71degradation starts of late days,
- Page 74 and 75:
73Fig. 4 Treated (after 28 days of
- Page 76:
75parameters of the cutting process
- Page 80 and 81:
79Fraction: D (residual rest) prese
- Page 82:
81was not confirmed. Maximum of mer
- Page 85 and 86:
84Fig. 1 Schematic diagram of atomi
- Page 87 and 88:
86Alpha spectrometryAlpha spectrome
- Page 89 and 90:
8880007000y = 6622xR 2 = 0.939SIMS
- Page 92 and 93:
91ACTA FACULTATIS ECOLOGIAE, 16: Su
- Page 94 and 95:
93Gemer according to the German mod
- Page 96 and 97:
95Tab. 1 Results of the chemical an
- Page 98 and 99:
97Continuation of Tab. 2 Results of
- Page 100 and 101:
99Vlčia Dolina and from the reserv
- Page 102 and 103:
101ACTA FACULTATIS ECOLOGIAE, 16: S
- Page 104 and 105:
103mg.dm -3mg.dm -35,004,003,002,00
- Page 106 and 107:
105year and the average value repre
- Page 108 and 109:
107ACTA FACULTATIS ECOLOGIAE, 16: S
- Page 110 and 111:
109Sample site 1 Sample site 2 Samp
- Page 112 and 113:
111As for the sampling time (Fig. 5
- Page 114 and 115:
113ACTA FACULTATIS ECOLOGIAE, 16: S
- Page 116 and 117:
115Typha latifolia, Carex sp., Scir
- Page 118 and 119:
117conditions for decomposition of
- Page 120 and 121: 119ACTA FACULTATIS ECOLOGIAE, 16: S
- Page 122 and 123: 121from the background (derived fro
- Page 124 and 125: 12311. PETROVSKÝ, E., ELWOOD, B.:
- Page 126 and 127: 125ACTA FACULTATIS ECOLOGIAE, 16: S
- Page 128 and 129: 1272.52.0Correlation coefficient 0,
- Page 130 and 131: 129ACTA FACULTATIS ECOLOGIAE, 16: S
- Page 132 and 133: 131RESULTS AND DISCUSSIONTable 2 gi
- Page 134 and 135: 133ACTA FACULTATIS ECOLOGIAE, 16: S
- Page 136 and 137: 135V-1 BOREHOLEThe courses of 222 R
- Page 138 and 139: 137AV-2 (40m) 2006A ( 222 Rn) [kBq/
- Page 140 and 141: 139soaks into the soil, another par
- Page 142 and 143: 141ACTA FACULTATIS ECOLOGIAE, 16: S
- Page 144 and 145: 143Fig. 2 The continuous monitoring
- Page 146 and 147: 145Indoor radon activity concentrat
- Page 148 and 149: 147ACTA FACULTATIS ECOLOGIAE, 16: S
- Page 150 and 151: 149Fig. 1 Podlipa dump-fieldCanada)
- Page 152 and 153: 151concentrations of Fe. Cu. Cd. Ni
- Page 154 and 155: 153DUMP-FIELDREFERENCE SITEppm15001
- Page 156 and 157: 155Fig. 5 Compression of wood forma
- Page 158 and 159: 157decrease in the following order:
- Page 160 and 161: 159ACTA FACULTATIS ECOLOGIAE, 16: S
- Page 162 and 163: 161SPECIFIC EXAMPLES OFFACTORS THAT
- Page 164 and 165: 163ACTA FACULTATIS ECOLOGIAE, 16: S
- Page 166 and 167: 165The methods developed to incorpo
- Page 168 and 169: 167The effects of wind on ozone con
- Page 172 and 173: 171transport modelling in North Ame
- Page 175: Acta Facultatis Ecologiae, Volume 1