Acta Facultatis Ecologiae - Technická univerzita vo Zvolene
Acta Facultatis Ecologiae - Technická univerzita vo Zvolene
Acta Facultatis Ecologiae - Technická univerzita vo Zvolene
- No tags were found...

You also want an ePaper? Increase the reach of your titles
YUMPU automatically turns print PDFs into web optimized ePapers that Google loves.
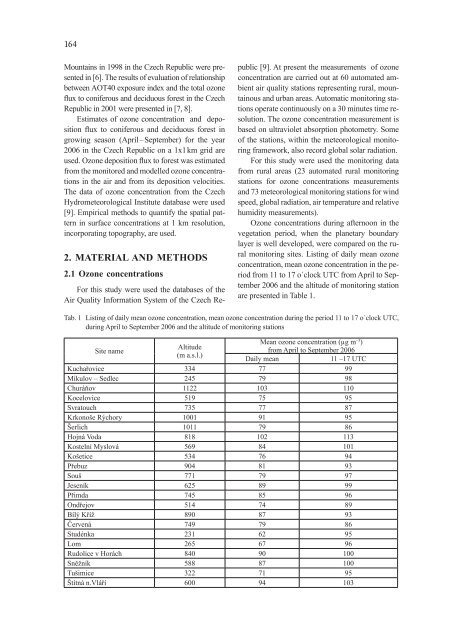
164Mountains in 1998 in the Czech Republic were presentedin [6]. The results of evaluation of relationshipbetween AOT40 exposure index and the total ozoneflux to coniferous and deciduous forest in the CzechRepublic in 2001 were presented in [7, 8].Estimates of ozone concentration and depositionflux to coniferous and deciduous forest ingrowing season (Apríl – September) for the year2006 in the Czech Republic on a 1x1 km grid areused. Ozone deposition flux to forest was estimatedfrom the monitored and modelled ozone concentrationsin the air and from its deposition velocities.The data of ozone concentration from the CzechHydrometeorological Institute database were used[9]. Empirical methods to quantify the spatial patternin surface concentrations at 1 km resolution,incorporating topography, are used.2. MATERIAL AND METHODS2.1 Ozone concentrationsFor this study were used the databases of theAir Quality Information System of the Czech Republic[9]. At present the measurements of ozoneconcentration are carried out at 60 automated ambientair quality stations representing rural, mountainousand urban areas. Automatic monitoring stationsoperate continuously on a 30 minutes time resolution.The ozone concentration measurement isbased on ultraviolet absorption photometry. Someof the stations, within the meteorological monitoringframework, also record global solar radiation.For this study were used the monitoring datafrom rural areas (23 automated rural monitoringstations for ozone concentrations measurementsand 73 meteorological monitoring stations for windspeed, global radiation, air temperature and relativehumidity measurements).Ozone concentrations during afternoon in thevegetation period, when the planetary boundarylayer is well developed, were compared on the ruralmonitoring sites. Listing of daily mean ozoneconcentration, mean ozone concentration in the periodfrom 11 to 17 o´clock UTC from April to September2006 and the altitude of monitoring stationare presented in Table 1.Tab. 1 Listing of daily mean ozone concentration, mean ozone concentration during the period 11 to 17 o´clock UTC,during April to September 2006 and the altitude of monitoring stationsSite nameMean ozone concentration (µg m –3 )Altitudefrom April to September 2006(m a.s.l.)Daily mean11 –17 UTCKuchařovice 334 77 99Mikulov – Sedlec 245 79 98Churáňov 1122 103 110Kocelovice 519 75 95Svratouch 735 77 87Krkonoše Rýchory 1001 91 95Šerlich 1011 79 86Hojná Voda 818 102 113Kostelní Myslová 569 84 101Košetice 534 76 94Přebuz 904 81 93Souš 771 79 97Jeseník 625 89 99Přimda 745 85 96Ondřejov 514 74 89Bílý Kříž 890 87 93Červená 749 79 86Studénka 231 62 95Lom 265 67 96Rudolice v Horách 840 90 100Sněžník 588 87 100Tušimice 322 71 95Štítná n.Vláří 600 94 103