These figures give an idea of the economic potential of the southern route and the growing importance ofthe way South using Lake Tanganyika. These tonnages from the south have been rising steadily for thepast four years (Table 5.5). It should be noted however that only 133,237 t were transported by lake in2010 and were composed largely of manufactured goods from Zambia (sugar and cement). Theseproducts find a market outlet in Burundi through the lake because of cheap transport cost (without thelake, Zambia would be at a greater economic distance from Burundi than China). Burundi's COMESAmembership has also made imports of Zambian products more accessible and more competitive.Table 5.5: Evolution of the tonnage of Burundi’s imports originating from the South2006 2007 2008 2009 2010 2011Zambia (1) 48,277 16,117 12,432 31,249 101,272 92,291South Africa (2) 5,446 6,120 4,107 3,266 5,244 12,566Zimbabwe (3) 204 639 121 109 72 106Total (1+2+3) 53,927 22,876 16,660 34,624 106,588 104,963Source: BRB (www.brb.bi/se/docs/bulmens/iv6.pdf)There is potential to further develop the Southern corridor. The southern route can become aworkable reality provided that transportation costs combining rail, road and lake are equivalent to, orcheaper than, the cost of shipping from East Asia, and COMESA custom tariffs remain attractive. Theeconomic potential in terms of transit for goods from the South (RSA, Zimbabwe, Zambia), to the EACand the DRC can only be fully realized if lake transport is properly organized and seamless modetransfer is introduced between road and lake transport in the south of Lake Tanganyika.6.4 Air Transport ConnectivityAir cargo volumes through Bujumbura airport are very low (Table 5.6). There is market potential,notably in fresh and processed horticultural commodities, which could be realized by providing efficientair transport services. However, the figures concerning air cargo have not changed much since 2006,suggesting that there has not been growth in demand. The market is particularly narrow and sluggish,and peaked in 2010 at 3,114 tons for import (59 tons / week) and 331 tons for export (6.3 tons / week).The demand seems limited and some products are available only in small quantities, which are notenough for dedicated services to remain competitive in foreign markets. Air carriers are prepared todeploy more capacity to Burundian trade only if production increases, while potential exporters wouldlike to have price guarantees and regularity before committing to production. One alternative to thisconundrum is to increase air transport connectivity by feeding Bujumbura traffic by road to Uganda andto Nairobi in particular, the air transport hub in East Africa. The price differential between air freight forsimilar products sent to Europe from Bujumbura and Nairobi is one euro per kilogram. This ispotentially a significant cost saving.Table 5.6: Traffic at Bujumbura international airport, in tons (cargo, baggage and postal)ImportExportYear commercial baggage postal commercial baggage postal2006 2,590 487 59 210 432 162007 2,251 491 38 278 403 242008 2,184 608 40 365 401 262009 2,416 736 51 275 495 332010 3,114 589 45 331 372 352011 2,240 436 46 310 290 26Source: BRB (http://brb.bi/se/docs/bulmens/v3.pdf)102 / 153
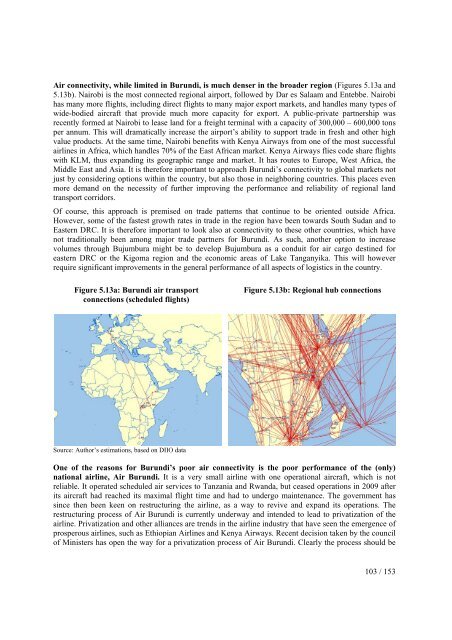
Air connectivity, while limited in Burundi, is much denser in the broader region (Figures 5.13a and5.13b). Nairobi is the most connected regional airport, followed by Dar es Salaam and Entebbe. Nairobihas many more flights, including direct flights to many major export markets, and handles many types ofwide-bodied aircraft that provide much more capacity for export. A public-private partnership wasrecently formed at Nairobi to lease land for a freight terminal with a capacity of 300,000 – 600,000 tonsper annum. This will dramatically increase the airport’s ability to support trade in fresh and other highvalue products. At the same time, Nairobi benefits with Kenya Airways from one of the most successfulairlines in Africa, which handles 70% of the East African market. Kenya Airways flies code share flightswith KLM, thus expanding its geographic range and market. It has routes to Europe, West Africa, theMiddle East and Asia. It is therefore important to approach Burundi’s connectivity to global markets notjust by considering options within the country, but also those in neighboring countries. This places evenmore demand on the necessity of further improving the performance and reliability of regional landtransport corridors.Of course, this approach is premised on trade patterns that continue to be oriented outside Africa.However, some of the fastest growth rates in trade in the region have been towards South Sudan and toEastern DRC. It is therefore important to look also at connectivity to these other countries, which havenot traditionally been among major trade partners for Burundi. As such, another option to increasevolumes through Bujumbura might be to develop Bujumbura as a conduit for air cargo destined foreastern DRC or the Kigoma region and the economic areas of Lake Tanganyika. This will howeverrequire significant improvements in the general performance of all aspects of logistics in the country.Figure 5.13a: Burundi air transportconnections (scheduled flights)Figure 5.13b: Regional hub connectionsSource: Author’s estimations, based on DIIO dataOne of the reasons for Burundi’s poor air connectivity is the poor performance of the (only)national airline, Air Burundi. It is a very small airline with one operational aircraft, which is notreliable. It operated scheduled air services to Tanzania and Rwanda, but ceased operations in 2009 afterits aircraft had reached its maximal flight time and had to undergo maintenance. The government hassince then been keen on restructuring the airline, as a way to revive and expand its operations. Therestructuring process of Air Burundi is currently underway and intended to lead to privatization of theairline. Privatization and other alliances are trends in the airline industry that have seen the emergence ofprosperous airlines, such as Ethiopian Airlines and Kenya Airways. Recent decision taken by the councilof Ministers has open the way for a privatization process of Air Burundi. Clearly the process should be103 / 153
- Page 1 and 2:
Republic of Burundi / Enhanced Inte
- Page 3 and 4:
Currency equivalent(Exchange rate a
- Page 5 and 6:
Executive summaryThe Government of
- Page 7 and 8:
Dar es Salaam (Tanzania) and Mombas
- Page 9 and 10:
II.3. Unorganized (agricultural) as
- Page 11 and 12:
making. Efforts to improve official
- Page 13 and 14:
Identified constraintregulatory fra
- Page 15 and 16:
Identified constraintProposed Actio
- Page 17 and 18:
(% GDP)50%40%30%20%10%Figure 1.2: e
- Page 19 and 20:
Burundi’s very narrow export base
- Page 21 and 22:
elatively well diversified - in 200
- Page 23 and 24:
ExportsImports(%)Share2001/03Share2
- Page 25 and 26:
Table 1.4 : Burundi’s trade in se
- Page 27 and 28:
scope for both automatic and discre
- Page 29 and 30:
exports. Burundi stands out as a he
- Page 31 and 32:
this, the Government has elaborated
- Page 33 and 34:
4,000Figure 1.11a: cost to export (
- Page 35 and 36:
The improvement of Burundi’s Doin
- Page 37 and 38:
Mainstreaming of trade into nationa
- Page 39 and 40:
constraints are required to impleme
- Page 41 and 42:
CHAPTER 2 - Regional integration: o
- Page 43 and 44:
4.3 percent to SSA as a whole. Most
- Page 45 and 46:
likely to facilitate deeper integra
- Page 47 and 48:
collection remain destination-based
- Page 49 and 50:
To-date, the approach to eliminateN
- Page 51 and 52: Figure 2.5: Improvements in doing b
- Page 53 and 54: Public awareness and stakeholders s
- Page 55 and 56: CHAPTER 3 - Export diversificationT
- Page 57 and 58: products, Figure 3.3 shows that Bur
- Page 59 and 60: Second, measures that encourage the
- Page 61 and 62: Figure 3.5: Burundian coffee value
- Page 63 and 64: ii. Addressing supply-side constrai
- Page 65 and 66: sales of specialty coffee by cooper
- Page 67 and 68: long distances, given the high cost
- Page 69 and 70: The over exploitation of land is of
- Page 71 and 72: logistics chain. Other types of fac
- Page 73 and 74: CHAPTER 4 - Non-tariff Measures: Th
- Page 75 and 76: Figure 4.1: Coverage and frequency
- Page 77 and 78: Some of the most heavily regulated
- Page 79 and 80: 2.2 Severity: the impact of NTMsWhi
- Page 81 and 82: In spite of efforts to improve the
- Page 83 and 84: standards, which kindly share the m
- Page 85 and 86: According to a testimony gathered i
- Page 87 and 88: public sectors would have more clou
- Page 89 and 90: CHAPTER 5 - Strengthening Trade Fac
- Page 91 and 92: ii. designing a program of action o
- Page 93 and 94: 3. Size of ShipmentsThe small avera
- Page 95 and 96: makes it possible for the coffee to
- Page 97 and 98: logistics services on the other. Ty
- Page 99 and 100: Table 5.3: Characteristics of Clear
- Page 101: The Central Corridor is potentially
- Page 105 and 106: Kigoma and Bujumbura lake ports. Th
- Page 107 and 108: In its Strategic Plan 2011-2015, th
- Page 109 and 110: increase reliability would therefor
- Page 111 and 112: 8. RecommendationsThe foregoing sho
- Page 113 and 114: Cooperation at the regional level a
- Page 115 and 116: (BIF billion) (%)1. Primary sector
- Page 117 and 118: A striking feature of Burundi’s s
- Page 119 and 120: Business servicesNumber of accounta
- Page 121 and 122: At the same time there exist severa
- Page 123 and 124: Under the capacity building compone
- Page 125 and 126: MadagascarCameroonSenegalKenyaMalaw
- Page 127 and 128: Explaining the Segmentation of Mark
- Page 129 and 130: . Adequate regulations that ensure
- Page 131 and 132: The pace of integration is largely
- Page 133 and 134: take time to overcome, are likely t
- Page 135 and 136: and to domestic travel spending, as
- Page 137 and 138: the attractiveness of the sector fo
- Page 139 and 140: 4. The challenges facing tourism in
- Page 141 and 142: supply, hospitals), and in large-sc
- Page 143 and 144: durable improvements in terms of st
- Page 145 and 146: - the introduction of a single EAC
- Page 147 and 148: Box 7.4: Examples of regional conse
- Page 149 and 150: cultural and social sustainability
- Page 151 and 152: ICG. 2012. Burundi: A Deepening Cor
- Page 153:
World Bank. 2010c. Reform and Regio