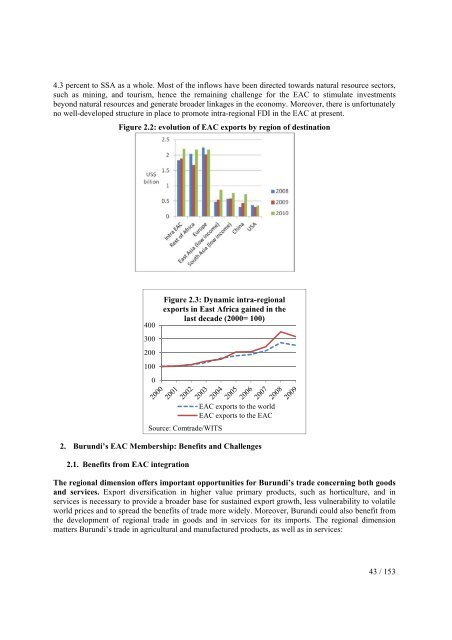
1. The EAC – A Dynamic Economic CommunityThe EAC is one of the fastest growing economic communities in the world. The EAC grew fasterthan all other economic communities in the last decade, except for ASEAN (Association of SoutheastAsian Nations) which grew at 6.1 percent (figure 2.1). The EAC grew at an average of 5.84 percent peryear between 2001-2009, and over the last decade each EAC country more than doubled its own GDP.The EAC also experienced unprecedented population growth – the region grew 25 percent from 110million people in 2002 to 138 million people in 2010. The region’s high population growth has beenclose to 3 percent per year over the last two decades, compared with the sub-Saharan Africa’s average of2.6 percent. The population in Kenya alone doubled over the last twenty-five years, and rapid populationgrowth is set to continue.Significant intra-regional country variations exist. Although each EAC country has grown in the lastdecade, growth has been unevenly distributed, with Tanzania, Uganda and Rwanda growing at anaverage of over 7 percent per year between 2002 and 2010, compared to Kenya and Burundi’s 3 and 4percent respectively. Kenya is the region’s largest economy, with a GDP of approximately US$ 32billion in 2010, followed by Tanzania, Uganda and Rwanda, and finally Burundi with a GDP of onlyUS$ 1.6 billion in 2010. GDP per capita has increased at an average of 112 percent across the regionbetween 2002 and 2010, and now ranges as widely as US$ 795 in Kenya to US$ 192 in Burundi.Figure 2.1: Average GDP growth (2002-10) in the EAC and selected comparatorsSource: WDI 2012Total EAC exports are increasing, and so are intra-regional exports as a proportion of totalexports. Total exports from EAC partner states grew at an average of 16 percent annually from US$ 6billion in 2002 to US$ 20 billion in 2010. Kenya, Tanzania, and Uganda (the founding members of theEAC) are the main sources of such growth in regional exports. During the next three years, Rwanda andBurundi are expected to accelerate their export growth in the EAC (albeit from relatively low levels),and both countries are expected to see export growth exceed import growth from 2015 onwards (NathanAssociates 2011). Intra-regional exports as a share of total exports increased from approximately 15percent in 2000-04 to approximately 19 percent in 2009-10, now represent around US$ 2.2 billion (seefigure 2.2). Compound annual growth rates (CAGR) of EAC exports within the region exceed those ofEAC exports to the rest of the world (see figure 2.3). Unlike EAC exports outside the region, which aremainly commodities, the bulk of intra-regional exports are manufactured goods (e.g. food products,beverages, tobacco, cement).There has been a notable increase in foreign direct investment in the EAC, but challenges remain.FDI flows to the EAC have increased threefold, from approximately US$ 590 million in 2000 toapproximately US$ 1.7 billion in 2010. FDI to East Africa’s two largest recipients, Uganda and Tanzania(US$ 850 and US$ 700 million respectively in 2010), has been stable in recent years. Nevertheless, onaverage, FDI flows to the EAC (2.5 percent of GDP in 2009) still remain below average flows of about42 / 153
4.3 percent to SSA as a whole. Most of the inflows have been directed towards natural resource sectors,such as mining, and tourism, hence the remaining challenge for the EAC to stimulate investmentsbeyond natural resources and generate broader linkages in the economy. Moreover, there is unfortunatelyno well-developed structure in place to promote intra-regional FDI in the EAC at present.Figure 2.2: evolution of EAC exports by region of destinationSource WDI 20124003002001000Figure 2.3: Dynamic intra-regionalexports in East Africa gained in thelast decade (2000= 100)Source: Comtrade/WITS2. Burundi’s EAC Membership: Benefits and Challenges2.1. Benefits from EAC integrationEAC exports to the worldEAC exports to the EACThe regional dimension offers important opportunities for Burundi’s trade concerning both goodsand services. Export diversification in higher value primary products, such as horticulture, and inservices is necessary to provide a broader base for sustained export growth, less vulnerability to volatileworld prices and to spread the benefits of trade more widely. Moreover, Burundi could also benefit fromthe development of regional trade in goods and in services for its imports. The regional dimensionmatters Burundi’s trade in agricultural and manufactured products, as well as in services:43 / 153
- Page 1 and 2: Republic of Burundi / Enhanced Inte
- Page 3 and 4: Currency equivalent(Exchange rate a
- Page 5 and 6: Executive summaryThe Government of
- Page 7 and 8: Dar es Salaam (Tanzania) and Mombas
- Page 9 and 10: II.3. Unorganized (agricultural) as
- Page 11 and 12: making. Efforts to improve official
- Page 13 and 14: Identified constraintregulatory fra
- Page 15 and 16: Identified constraintProposed Actio
- Page 17 and 18: (% GDP)50%40%30%20%10%Figure 1.2: e
- Page 19 and 20: Burundi’s very narrow export base
- Page 21 and 22: elatively well diversified - in 200
- Page 23 and 24: ExportsImports(%)Share2001/03Share2
- Page 25 and 26: Table 1.4 : Burundi’s trade in se
- Page 27 and 28: scope for both automatic and discre
- Page 29 and 30: exports. Burundi stands out as a he
- Page 31 and 32: this, the Government has elaborated
- Page 33 and 34: 4,000Figure 1.11a: cost to export (
- Page 35 and 36: The improvement of Burundi’s Doin
- Page 37 and 38: Mainstreaming of trade into nationa
- Page 39 and 40: constraints are required to impleme
- Page 41: CHAPTER 2 - Regional integration: o
- Page 45 and 46: likely to facilitate deeper integra
- Page 47 and 48: collection remain destination-based
- Page 49 and 50: To-date, the approach to eliminateN
- Page 51 and 52: Figure 2.5: Improvements in doing b
- Page 53 and 54: Public awareness and stakeholders s
- Page 55 and 56: CHAPTER 3 - Export diversificationT
- Page 57 and 58: products, Figure 3.3 shows that Bur
- Page 59 and 60: Second, measures that encourage the
- Page 61 and 62: Figure 3.5: Burundian coffee value
- Page 63 and 64: ii. Addressing supply-side constrai
- Page 65 and 66: sales of specialty coffee by cooper
- Page 67 and 68: long distances, given the high cost
- Page 69 and 70: The over exploitation of land is of
- Page 71 and 72: logistics chain. Other types of fac
- Page 73 and 74: CHAPTER 4 - Non-tariff Measures: Th
- Page 75 and 76: Figure 4.1: Coverage and frequency
- Page 77 and 78: Some of the most heavily regulated
- Page 79 and 80: 2.2 Severity: the impact of NTMsWhi
- Page 81 and 82: In spite of efforts to improve the
- Page 83 and 84: standards, which kindly share the m
- Page 85 and 86: According to a testimony gathered i
- Page 87 and 88: public sectors would have more clou
- Page 89 and 90: CHAPTER 5 - Strengthening Trade Fac
- Page 91 and 92: ii. designing a program of action o
- Page 93 and 94:
3. Size of ShipmentsThe small avera
- Page 95 and 96:
makes it possible for the coffee to
- Page 97 and 98:
logistics services on the other. Ty
- Page 99 and 100:
Table 5.3: Characteristics of Clear
- Page 101 and 102:
The Central Corridor is potentially
- Page 103 and 104:
Air connectivity, while limited in
- Page 105 and 106:
Kigoma and Bujumbura lake ports. Th
- Page 107 and 108:
In its Strategic Plan 2011-2015, th
- Page 109 and 110:
increase reliability would therefor
- Page 111 and 112:
8. RecommendationsThe foregoing sho
- Page 113 and 114:
Cooperation at the regional level a
- Page 115 and 116:
(BIF billion) (%)1. Primary sector
- Page 117 and 118:
A striking feature of Burundi’s s
- Page 119 and 120:
Business servicesNumber of accounta
- Page 121 and 122:
At the same time there exist severa
- Page 123 and 124:
Under the capacity building compone
- Page 125 and 126:
MadagascarCameroonSenegalKenyaMalaw
- Page 127 and 128:
Explaining the Segmentation of Mark
- Page 129 and 130:
. Adequate regulations that ensure
- Page 131 and 132:
The pace of integration is largely
- Page 133 and 134:
take time to overcome, are likely t
- Page 135 and 136:
and to domestic travel spending, as
- Page 137 and 138:
the attractiveness of the sector fo
- Page 139 and 140:
4. The challenges facing tourism in
- Page 141 and 142:
supply, hospitals), and in large-sc
- Page 143 and 144:
durable improvements in terms of st
- Page 145 and 146:
- the introduction of a single EAC
- Page 147 and 148:
Box 7.4: Examples of regional conse
- Page 149 and 150:
cultural and social sustainability
- Page 151 and 152:
ICG. 2012. Burundi: A Deepening Cor
- Page 153:
World Bank. 2010c. Reform and Regio