

(DTIS) Update, Volume 1 â Main report - Enhanced Integrated ...
(DTIS) Update, Volume 1 â Main report - Enhanced Integrated ...
(DTIS) Update, Volume 1 â Main report - Enhanced Integrated ...

You also want an ePaper? Increase the reach of your titles
YUMPU automatically turns print PDFs into web optimized ePapers that Google loves.
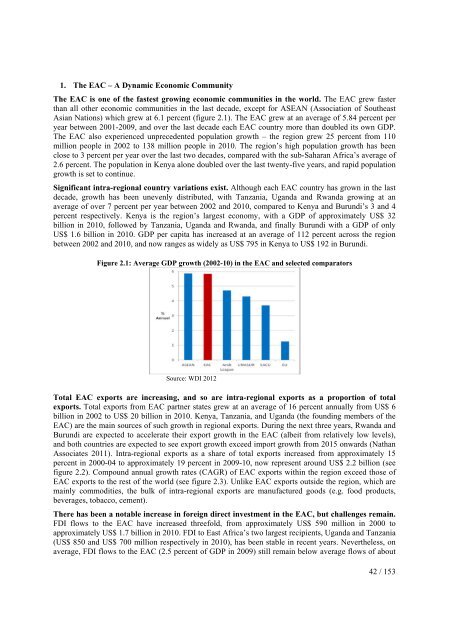
1. The EAC – A Dynamic Economic CommunityThe EAC is one of the fastest growing economic communities in the world. The EAC grew fasterthan all other economic communities in the last decade, except for ASEAN (Association of SoutheastAsian Nations) which grew at 6.1 percent (figure 2.1). The EAC grew at an average of 5.84 percent peryear between 2001-2009, and over the last decade each EAC country more than doubled its own GDP.The EAC also experienced unprecedented population growth – the region grew 25 percent from 110million people in 2002 to 138 million people in 2010. The region’s high population growth has beenclose to 3 percent per year over the last two decades, compared with the sub-Saharan Africa’s average of2.6 percent. The population in Kenya alone doubled over the last twenty-five years, and rapid populationgrowth is set to continue.Significant intra-regional country variations exist. Although each EAC country has grown in the lastdecade, growth has been unevenly distributed, with Tanzania, Uganda and Rwanda growing at anaverage of over 7 percent per year between 2002 and 2010, compared to Kenya and Burundi’s 3 and 4percent respectively. Kenya is the region’s largest economy, with a GDP of approximately US$ 32billion in 2010, followed by Tanzania, Uganda and Rwanda, and finally Burundi with a GDP of onlyUS$ 1.6 billion in 2010. GDP per capita has increased at an average of 112 percent across the regionbetween 2002 and 2010, and now ranges as widely as US$ 795 in Kenya to US$ 192 in Burundi.Figure 2.1: Average GDP growth (2002-10) in the EAC and selected comparatorsSource: WDI 2012Total EAC exports are increasing, and so are intra-regional exports as a proportion of totalexports. Total exports from EAC partner states grew at an average of 16 percent annually from US$ 6billion in 2002 to US$ 20 billion in 2010. Kenya, Tanzania, and Uganda (the founding members of theEAC) are the main sources of such growth in regional exports. During the next three years, Rwanda andBurundi are expected to accelerate their export growth in the EAC (albeit from relatively low levels),and both countries are expected to see export growth exceed import growth from 2015 onwards (NathanAssociates 2011). Intra-regional exports as a share of total exports increased from approximately 15percent in 2000-04 to approximately 19 percent in 2009-10, now represent around US$ 2.2 billion (seefigure 2.2). Compound annual growth rates (CAGR) of EAC exports within the region exceed those ofEAC exports to the rest of the world (see figure 2.3). Unlike EAC exports outside the region, which aremainly commodities, the bulk of intra-regional exports are manufactured goods (e.g. food products,beverages, tobacco, cement).There has been a notable increase in foreign direct investment in the EAC, but challenges remain.FDI flows to the EAC have increased threefold, from approximately US$ 590 million in 2000 toapproximately US$ 1.7 billion in 2010. FDI to East Africa’s two largest recipients, Uganda and Tanzania(US$ 850 and US$ 700 million respectively in 2010), has been stable in recent years. Nevertheless, onaverage, FDI flows to the EAC (2.5 percent of GDP in 2009) still remain below average flows of about42 / 153


