

(DTIS) Update, Volume 1 â Main report - Enhanced Integrated ...
(DTIS) Update, Volume 1 â Main report - Enhanced Integrated ...
(DTIS) Update, Volume 1 â Main report - Enhanced Integrated ...

Create successful ePaper yourself
Turn your PDF publications into a flip-book with our unique Google optimized e-Paper software.
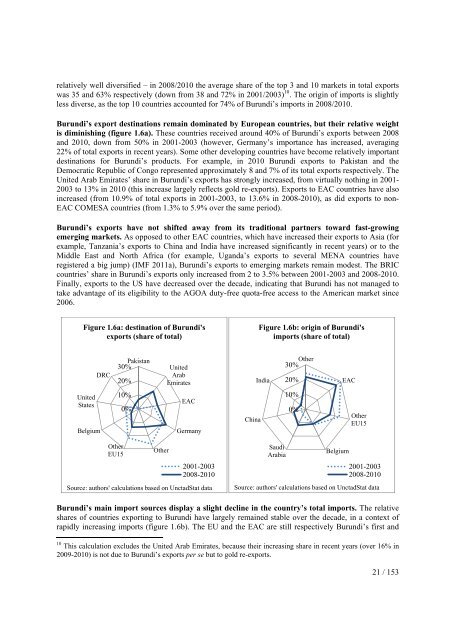
elatively well diversified – in 2008/2010 the average share of the top 3 and 10 markets in total exportswas 35 and 63% respectively (down from 38 and 72% in 2001/2003) 10 . The origin of imports is slightlyless diverse, as the top 10 countries accounted for 74% of Burundi’s imports in 2008/2010.Burundi’s export destinations remain dominated by European countries, but their relative weightis diminishing (figure 1.6a). These countries received around 40% of Burundi’s exports between 2008and 2010, down from 50% in 2001-2003 (however, Germany’s importance has increased, averaging22% of total exports in recent years). Some other developing countries have become relatively importantdestinations for Burundi’s products. For example, in 2010 Burundi exports to Pakistan and theDemocratic Republic of Congo represented approximately 8 and 7% of its total exports respectively. TheUnited Arab Emirates’ share in Burundi’s exports has strongly increased, from virtually nothing in 2001-2003 to 13% in 2010 (this increase largely reflects gold re-exports). Exports to EAC countries have alsoincreased (from 10.9% of total exports in 2001-2003, to 13.6% in 2008-2010), as did exports to non-EAC COMESA countries (from 1.3% to 5.9% over the same period).Burundi’s exports have not shifted away from its traditional partners toward fast-growingemerging markets. As opposed to other EAC countries, which have increased their exports to Asia (forexample, Tanzania’s exports to China and India have increased significantly in recent years) or to theMiddle East and North Africa (for example, Uganda’s exports to several MENA countries haveregistered a big jump) (IMF 2011a), Burundi’s exports to emerging markets remain modest. The BRICcountries’ share in Burundi’s exports only increased from 2 to 3.5% between 2001-2003 and 2008-2010.Finally, exports to the US have decreased over the decade, indicating that Burundi has not managed totake advantage of its eligibility to the AGOA duty-free quota-free access to the American market since2006.Figure 1.6a: destination of Burundi'sexports (share of total)Figure 1.6b: origin of Burundi'simports (share of total)DRC30% Pakistan United20%ArabEmiratesIndia30% Other20%EACUnitedStatesBelgium10%0%EACGermanyChina10%0%OtherEU15OtherEU15Other2001-20032008-2010Source: authors' calculations based on UnctadStat dataSaudiArabiaBelgium2001-20032008-2010Source: authors' calculations based on UnctadStat dataBurundi’s main import sources display a slight decline in the country’s total imports. The relativeshares of countries exporting to Burundi have largely remained stable over the decade, in a context ofrapidly increasing imports (figure 1.6b). The EU and the EAC are still respectively Burundi’s first and10 This calculation excludes the United Arab Emirates, because their increasing share in recent years (over 16% in2009-2010) is not due to Burundi’s exports per se but to gold re-exports.21 / 153


