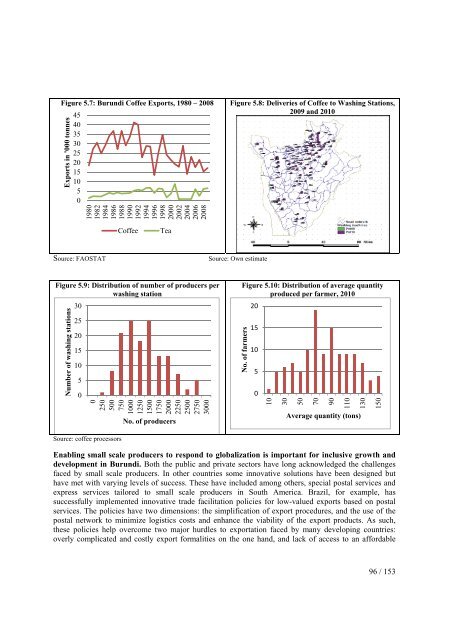
Figure 5.7: Burundi Coffee Exports, 1980 – 2008454035302520151050Exports in '000 tonnes198019821984198619881990199219941996199820002002200420062008Figure 5.8: Deliveries of Coffee to Washing Stations,2009 and 2010CoffeeTeaSource: FAOSTATSource: Own estimateFigure 5.9: Distribution of number of producers perwashing stationNumber of washing stations3025201510500250500750100012501500175020002250250027503000No. of producersFigure 5.10: Distribution of average quantityproduced per farmer, 2010No. of farmers201510501030507090110130Average quantity (tons)150Source: coffee processorsEnabling small scale producers to respond to globalization is important for inclusive growth anddevelopment in Burundi. Both the public and private sectors have long acknowledged the challengesfaced by small scale producers. In other countries some innovative solutions have been designed buthave met with varying levels of success. These have included among others, special postal services andexpress services tailored to small scale producers in South America. Brazil, for example, hassuccessfully implemented innovative trade facilitation policies for low-valued exports based on postalservices. The policies have two dimensions: the simplification of export procedures, and the use of thepostal network to minimize logistics costs and enhance the viability of the export products. As such,these policies help overcome two major hurdles to exportation faced by many developing countries:overly complicated and costly export formalities on the one hand, and lack of access to an affordable96 / 153
logistics services on the other. Typically, some of the greatest constraints are at the local level, and howflows cascade from local to international logistics chains.6. Regional and international connectivity 94Regional transport corridors are at the heart of regional integration in East Africa, as they areacross most of Africa given the large number of landlocked countries. The corridors are necessaryfor regional integration to achieve maximum potential, to expand and to integrate markets, exploiteconomies of scale, and attract foreign direct investment. The development of regional markets, in turn,creates interdependencies that increase the demand for infrastructure. Traded goods flow through roads,railways, inland waterways, ports and airports, as do people seeking to take advantage of attractiveservices or job opportunities in other nations. Therefore, an efficient and integrated transport systemfacilitates trade and factor mobility. It is connective infrastructure that can effectively reduce theeconomic distance between locations for merchandise trade (World Bank 2009). By enhancingconnectivity, regional infrastructure (especially in the form of transport and communication corridors)can facilitate the exploitation of economies of scale and scope, make possible greater specialization inproduction, and allow for more efficient division of labor. The most important benefits of regionalinfrastructure derive from network externalities.Infrastructure development that impacts Burundi’s regional and global connectivity has largelybeen designed around trade corridors. Burundi has access to the sea through two main corridors,namely the Northern Corridor, connecting to the Port of Mombasa, and the Central Corridor, connectingto the Port of Dar es Salaam. Due to its shorter length, the dominant trade route has traditionally been theCentral Corridor, which accounts for more than 80% of import and export volumes (Figure 5.11).250,000200,000Figure 5.11: <strong>Volume</strong> of Burundi cargo handled throughDar es Salaam and MombasaDarMombasa<strong>Volume</strong> (tons)150,000100,00050,00001992 1994 1996 1998 2000 2002 2004 2006 2008 2010Source: Kenya and Tanzania Ports AuhtoritiesThe volume of Burundi traffic passing through the Northern Corridor and using the port ofMombasa has always been small. Less than 7,000 tons of Burundi’s traffic passed through this port in2010 (Figure 5.11). It is clear from the above figure that when the Central Corridor performs well thevolumes on the Northern Corridor decline, and vice versa. With the exception of tea (normally less than10,000 t/year), which is still auctioned in Mombasa, a large proportion of the cargo flow using theNorthern Corridor is comprised of goods originating from the EAC market. However, the fact that94 See Annex 6 (<strong>Volume</strong> II) for a map of the main transportation routes in East Africa.97 / 153
- Page 1 and 2:
Republic of Burundi / Enhanced Inte
- Page 3 and 4:
Currency equivalent(Exchange rate a
- Page 5 and 6:
Executive summaryThe Government of
- Page 7 and 8:
Dar es Salaam (Tanzania) and Mombas
- Page 9 and 10:
II.3. Unorganized (agricultural) as
- Page 11 and 12:
making. Efforts to improve official
- Page 13 and 14:
Identified constraintregulatory fra
- Page 15 and 16:
Identified constraintProposed Actio
- Page 17 and 18:
(% GDP)50%40%30%20%10%Figure 1.2: e
- Page 19 and 20:
Burundi’s very narrow export base
- Page 21 and 22:
elatively well diversified - in 200
- Page 23 and 24:
ExportsImports(%)Share2001/03Share2
- Page 25 and 26:
Table 1.4 : Burundi’s trade in se
- Page 27 and 28:
scope for both automatic and discre
- Page 29 and 30:
exports. Burundi stands out as a he
- Page 31 and 32:
this, the Government has elaborated
- Page 33 and 34:
4,000Figure 1.11a: cost to export (
- Page 35 and 36:
The improvement of Burundi’s Doin
- Page 37 and 38:
Mainstreaming of trade into nationa
- Page 39 and 40:
constraints are required to impleme
- Page 41 and 42:
CHAPTER 2 - Regional integration: o
- Page 43 and 44:
4.3 percent to SSA as a whole. Most
- Page 45 and 46: likely to facilitate deeper integra
- Page 47 and 48: collection remain destination-based
- Page 49 and 50: To-date, the approach to eliminateN
- Page 51 and 52: Figure 2.5: Improvements in doing b
- Page 53 and 54: Public awareness and stakeholders s
- Page 55 and 56: CHAPTER 3 - Export diversificationT
- Page 57 and 58: products, Figure 3.3 shows that Bur
- Page 59 and 60: Second, measures that encourage the
- Page 61 and 62: Figure 3.5: Burundian coffee value
- Page 63 and 64: ii. Addressing supply-side constrai
- Page 65 and 66: sales of specialty coffee by cooper
- Page 67 and 68: long distances, given the high cost
- Page 69 and 70: The over exploitation of land is of
- Page 71 and 72: logistics chain. Other types of fac
- Page 73 and 74: CHAPTER 4 - Non-tariff Measures: Th
- Page 75 and 76: Figure 4.1: Coverage and frequency
- Page 77 and 78: Some of the most heavily regulated
- Page 79 and 80: 2.2 Severity: the impact of NTMsWhi
- Page 81 and 82: In spite of efforts to improve the
- Page 83 and 84: standards, which kindly share the m
- Page 85 and 86: According to a testimony gathered i
- Page 87 and 88: public sectors would have more clou
- Page 89 and 90: CHAPTER 5 - Strengthening Trade Fac
- Page 91 and 92: ii. designing a program of action o
- Page 93 and 94: 3. Size of ShipmentsThe small avera
- Page 95: makes it possible for the coffee to
- Page 99 and 100: Table 5.3: Characteristics of Clear
- Page 101 and 102: The Central Corridor is potentially
- Page 103 and 104: Air connectivity, while limited in
- Page 105 and 106: Kigoma and Bujumbura lake ports. Th
- Page 107 and 108: In its Strategic Plan 2011-2015, th
- Page 109 and 110: increase reliability would therefor
- Page 111 and 112: 8. RecommendationsThe foregoing sho
- Page 113 and 114: Cooperation at the regional level a
- Page 115 and 116: (BIF billion) (%)1. Primary sector
- Page 117 and 118: A striking feature of Burundi’s s
- Page 119 and 120: Business servicesNumber of accounta
- Page 121 and 122: At the same time there exist severa
- Page 123 and 124: Under the capacity building compone
- Page 125 and 126: MadagascarCameroonSenegalKenyaMalaw
- Page 127 and 128: Explaining the Segmentation of Mark
- Page 129 and 130: . Adequate regulations that ensure
- Page 131 and 132: The pace of integration is largely
- Page 133 and 134: take time to overcome, are likely t
- Page 135 and 136: and to domestic travel spending, as
- Page 137 and 138: the attractiveness of the sector fo
- Page 139 and 140: 4. The challenges facing tourism in
- Page 141 and 142: supply, hospitals), and in large-sc
- Page 143 and 144: durable improvements in terms of st
- Page 145 and 146: - the introduction of a single EAC
- Page 147 and 148:
Box 7.4: Examples of regional conse
- Page 149 and 150:
cultural and social sustainability
- Page 151 and 152:
ICG. 2012. Burundi: A Deepening Cor
- Page 153:
World Bank. 2010c. Reform and Regio