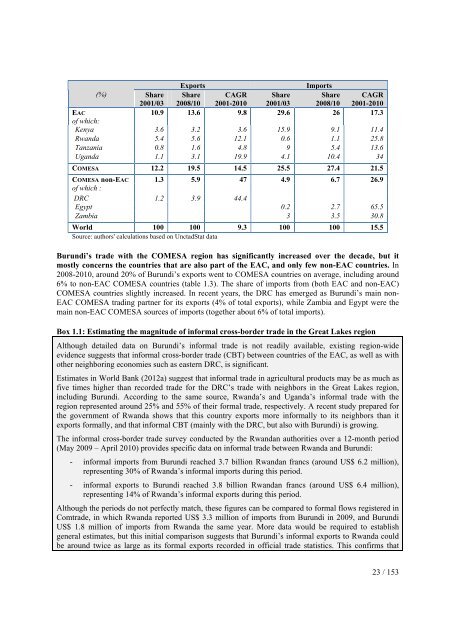
second largest source markets, but their share decreased (from 35 to 28% and from 30 to 26%,respectively). Growing sources of imports include Saudi Arabia (12% of imports in recent years, mainlyfor oil) and China (from less than 3% in 2003 to 9% in 2010).The EAC has become an increasingly important region for Burundi’s exports since 2001. Bothexports to and imports from the EAC have rapidly increased over the last decade (Figure 1.7a and 1.7b).Moreover, this assessment is based on official statistics, which do not record informal cross-border flowsand are therefore likely to underestimate the significance of regional trade (see Box 1.1 for moreinformation on informal trade flows in the Great Lakes region). The share of Burundi’s exports going toEAC countries has increased (table 1.3), a dynamic which started in the years preceding Burundi’saccession to the Community 11 . The shares of total exports going to Rwanda (5.6%) and Kenya (3.2%)have been stable, but the shares of Uganda and Tanzania have increased over the decade (from 1.1% and0.8% respectively in 2001-2003, to 3.1% and 1.6% in recent years). Burundi’s main exports to the EACinclude hides and skins (around 25%), raw cane sugar (20%), ferrous waste and scraps (17%), coffee andtea (8%) and soap (5%) 12 .15,00010,0005,000Figure 1.7a: evolution of Burundi'sexports to EAC countries(USD thousands)02001 2003 2005 2007 2009Source: UnctadStat (mirror data)UgandaTanzaniaRwandaKenyaFigure 1.7b: evolution of Burundi'simports from EAC countries(USD thousands)125,000100,00075,00050,00025,00002001 2003 2005 2007 2009Source: UnctadStatUgandaTanzaniaRwandaKenyaConcerning imports, the EAC remains one of the main sources of supply for Burundi 13 . Therelative importance of the four EAC partner countries in Burundi’s imports varied between 2001/03 and2008/10: Uganda’s share increased from 4 to 10% of total imports, while Kenya and Tanzania saw theirshare decrease (respectively from 16 to 9% and from 9 to 5%). Imports from EAC countries are morediverse than exports, but consist mainly of materials like iron and steel (18%) or cement (14%), paperand related manufactures (11%); of other manufactures (20%); of chemicals and related products (15%);and of cereals and other foodstuffs (11%).Table 1.3 : evolution of Burundi’s intraregional trade11 Exchanges between Kenya, Burundi, Rwanda and Uganda have been progressively liberalized between 2000 and2005, as these countries successively joined the COMESA Free Trade Agreement. Tanzania withdrew from theCOMESA in 2000, and its exchanges with Burundi were not liberalized until Burundi’s adhesion to the EAC.12 Gross exports to the EAC also include various re-exports of manufactures (EAC 2010).13The share of imports from the EAC in total imports has slightly decreased, but imports from the EAC havestrongly increased in value (Figure 1.7b).22 / 153
ExportsImports(%)Share2001/03Share2008/10CAGR2001-2010Share2001/03Share2008/10CAGR2001-2010EAC10.9 13.6 9.8 29.6 26 17.3of which:Kenya 3.6 3.2 3.6 15.9 9.1 11.4Rwanda 5.4 5.6 12.1 0.6 1.1 25.8Tanzania 0.8 1.6 4.8 9 5.4 13.6Uganda 1.1 3.1 19.9 4.1 10.4 34COMESA 12.2 19.5 14.5 25.5 27.4 21.5COMESA non-EAC 1.3 5.9 47 4.9 6.7 26.9of which :DRC 1.2 3.9 44.4Egypt 0.2 2.7 65.5Zambia 3 3.5 30.8World 100 100 9.3 100 100 15.5Source: authors' calculations based on UnctadStat dataBurundi’s trade with the COMESA region has significantly increased over the decade, but itmostly concerns the countries that are also part of the EAC, and only few non-EAC countries. In2008-2010, around 20% of Burundi’s exports went to COMESA countries on average, including around6% to non-EAC COMESA countries (table 1.3). The share of imports from (both EAC and non-EAC)COMESA countries slightly increased. In recent years, the DRC has emerged as Burundi’s main non-EAC COMESA trading partner for its exports (4% of total exports), while Zambia and Egypt were themain non-EAC COMESA sources of imports (together about 6% of total imports).Box 1.1: Estimating the magnitude of informal cross-border trade in the Great Lakes regionAlthough detailed data on Burundi’s informal trade is not readily available, existing region-wideevidence suggests that informal cross-border trade (CBT) between countries of the EAC, as well as withother neighboring economies such as eastern DRC, is significant.Estimates in World Bank (2012a) suggest that informal trade in agricultural products may be as much asfive times higher than recorded trade for the DRC’s trade with neighbors in the Great Lakes region,including Burundi. According to the same source, Rwanda’s and Uganda’s informal trade with theregion represented around 25% and 55% of their formal trade, respectively. A recent study prepared forthe government of Rwanda shows that this country exports more informally to its neighbors than itexports formally, and that informal CBT (mainly with the DRC, but also with Burundi) is growing.The informal cross-border trade survey conducted by the Rwandan authorities over a 12-month period(May 2009 – April 2010) provides specific data on informal trade between Rwanda and Burundi:- informal imports from Burundi reached 3.7 billion Rwandan francs (around US$ 6.2 million),representing 30% of Rwanda’s informal imports during this period.- informal exports to Burundi reached 3.8 billion Rwandan francs (around US$ 6.4 million),representing 14% of Rwanda’s informal exports during this period.Although the periods do not perfectly match, these figures can be compared to formal flows registered inComtrade, in which Rwanda <strong>report</strong>ed US$ 3.3 million of imports from Burundi in 2009, and BurundiUS$ 1.8 million of imports from Rwanda the same year. More data would be required to establishgeneral estimates, but this initial comparison suggests that Burundi’s informal exports to Rwanda couldbe around twice as large as its formal exports recorded in official trade statistics. This confirms that23 / 153
- Page 1 and 2: Republic of Burundi / Enhanced Inte
- Page 3 and 4: Currency equivalent(Exchange rate a
- Page 5 and 6: Executive summaryThe Government of
- Page 7 and 8: Dar es Salaam (Tanzania) and Mombas
- Page 9 and 10: II.3. Unorganized (agricultural) as
- Page 11 and 12: making. Efforts to improve official
- Page 13 and 14: Identified constraintregulatory fra
- Page 15 and 16: Identified constraintProposed Actio
- Page 17 and 18: (% GDP)50%40%30%20%10%Figure 1.2: e
- Page 19 and 20: Burundi’s very narrow export base
- Page 21: elatively well diversified - in 200
- Page 25 and 26: Table 1.4 : Burundi’s trade in se
- Page 27 and 28: scope for both automatic and discre
- Page 29 and 30: exports. Burundi stands out as a he
- Page 31 and 32: this, the Government has elaborated
- Page 33 and 34: 4,000Figure 1.11a: cost to export (
- Page 35 and 36: The improvement of Burundi’s Doin
- Page 37 and 38: Mainstreaming of trade into nationa
- Page 39 and 40: constraints are required to impleme
- Page 41 and 42: CHAPTER 2 - Regional integration: o
- Page 43 and 44: 4.3 percent to SSA as a whole. Most
- Page 45 and 46: likely to facilitate deeper integra
- Page 47 and 48: collection remain destination-based
- Page 49 and 50: To-date, the approach to eliminateN
- Page 51 and 52: Figure 2.5: Improvements in doing b
- Page 53 and 54: Public awareness and stakeholders s
- Page 55 and 56: CHAPTER 3 - Export diversificationT
- Page 57 and 58: products, Figure 3.3 shows that Bur
- Page 59 and 60: Second, measures that encourage the
- Page 61 and 62: Figure 3.5: Burundian coffee value
- Page 63 and 64: ii. Addressing supply-side constrai
- Page 65 and 66: sales of specialty coffee by cooper
- Page 67 and 68: long distances, given the high cost
- Page 69 and 70: The over exploitation of land is of
- Page 71 and 72: logistics chain. Other types of fac
- Page 73 and 74:
CHAPTER 4 - Non-tariff Measures: Th
- Page 75 and 76:
Figure 4.1: Coverage and frequency
- Page 77 and 78:
Some of the most heavily regulated
- Page 79 and 80:
2.2 Severity: the impact of NTMsWhi
- Page 81 and 82:
In spite of efforts to improve the
- Page 83 and 84:
standards, which kindly share the m
- Page 85 and 86:
According to a testimony gathered i
- Page 87 and 88:
public sectors would have more clou
- Page 89 and 90:
CHAPTER 5 - Strengthening Trade Fac
- Page 91 and 92:
ii. designing a program of action o
- Page 93 and 94:
3. Size of ShipmentsThe small avera
- Page 95 and 96:
makes it possible for the coffee to
- Page 97 and 98:
logistics services on the other. Ty
- Page 99 and 100:
Table 5.3: Characteristics of Clear
- Page 101 and 102:
The Central Corridor is potentially
- Page 103 and 104:
Air connectivity, while limited in
- Page 105 and 106:
Kigoma and Bujumbura lake ports. Th
- Page 107 and 108:
In its Strategic Plan 2011-2015, th
- Page 109 and 110:
increase reliability would therefor
- Page 111 and 112:
8. RecommendationsThe foregoing sho
- Page 113 and 114:
Cooperation at the regional level a
- Page 115 and 116:
(BIF billion) (%)1. Primary sector
- Page 117 and 118:
A striking feature of Burundi’s s
- Page 119 and 120:
Business servicesNumber of accounta
- Page 121 and 122:
At the same time there exist severa
- Page 123 and 124:
Under the capacity building compone
- Page 125 and 126:
MadagascarCameroonSenegalKenyaMalaw
- Page 127 and 128:
Explaining the Segmentation of Mark
- Page 129 and 130:
. Adequate regulations that ensure
- Page 131 and 132:
The pace of integration is largely
- Page 133 and 134:
take time to overcome, are likely t
- Page 135 and 136:
and to domestic travel spending, as
- Page 137 and 138:
the attractiveness of the sector fo
- Page 139 and 140:
4. The challenges facing tourism in
- Page 141 and 142:
supply, hospitals), and in large-sc
- Page 143 and 144:
durable improvements in terms of st
- Page 145 and 146:
- the introduction of a single EAC
- Page 147 and 148:
Box 7.4: Examples of regional conse
- Page 149 and 150:
cultural and social sustainability
- Page 151 and 152:
ICG. 2012. Burundi: A Deepening Cor
- Page 153:
World Bank. 2010c. Reform and Regio