

(DTIS) Update, Volume 1 â Main report - Enhanced Integrated ...
(DTIS) Update, Volume 1 â Main report - Enhanced Integrated ...
(DTIS) Update, Volume 1 â Main report - Enhanced Integrated ...

You also want an ePaper? Increase the reach of your titles
YUMPU automatically turns print PDFs into web optimized ePapers that Google loves.
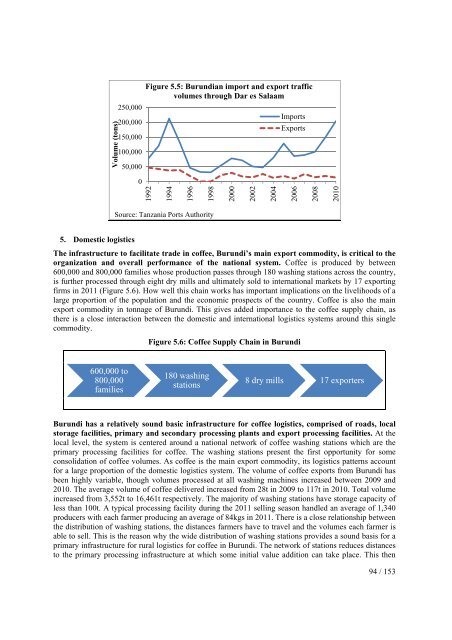
<strong>Volume</strong> (tons)250,000200,000150,000100,00050,000Figure 5.5: Burundian import and export trafficvolumes through Dar es SalaamImportsExports01992199419961998200020022004200620082010Source: Tanzania Ports Authority5. Domestic logisticsThe infrastructure to facilitate trade in coffee, Burundi’s main export commodity, is critical to theorganization and overall performance of the national system. Coffee is produced by between600,000 and 800,000 families whose production passes through 180 washing stations across the country,is further processed through eight dry mills and ultimately sold to international markets by 17 exportingfirms in 2011 (Figure 5.6). How well this chain works has important implications on the livelihoods of alarge proportion of the population and the economic prospects of the country. Coffee is also the mainexport commodity in tonnage of Burundi. This gives added importance to the coffee supply chain, asthere is a close interaction between the domestic and international logistics systems around this singlecommodity.Figure 5.6: Coffee Supply Chain in Burundi600,000 to800,000families180 washingstations8 dry mills 17 exportersBurundi has a relatively sound basic infrastructure for coffee logistics, comprised of roads, localstorage facilities, primary and secondary processing plants and export processing facilities. At thelocal level, the system is centered around a national network of coffee washing stations which are theprimary processing facilities for coffee. The washing stations present the first opportunity for someconsolidation of coffee volumes. As coffee is the main export commodity, its logistics patterns accountfor a large proportion of the domestic logistics system. The volume of coffee exports from Burundi hasbeen highly variable, though volumes processed at all washing machines increased between 2009 and2010. The average volume of coffee delivered increased from 28t in 2009 to 117t in 2010. Total volumeincreased from 3,552t to 16,461t respectively. The majority of washing stations have storage capacity ofless than 100t. A typical processing facility during the 2011 selling season handled an average of 1,340producers with each farmer producing an average of 84kgs in 2011. There is a close relationship betweenthe distribution of washing stations, the distances farmers have to travel and the volumes each farmer isable to sell. This is the reason why the wide distribution of washing stations provides a sound basis for aprimary infrastructure for rural logistics for coffee in Burundi. The network of stations reduces distancesto the primary processing infrastructure at which some initial value addition can take place. This then94 / 153


