

(DTIS) Update, Volume 1 â Main report - Enhanced Integrated ...
(DTIS) Update, Volume 1 â Main report - Enhanced Integrated ...
(DTIS) Update, Volume 1 â Main report - Enhanced Integrated ...

You also want an ePaper? Increase the reach of your titles
YUMPU automatically turns print PDFs into web optimized ePapers that Google loves.
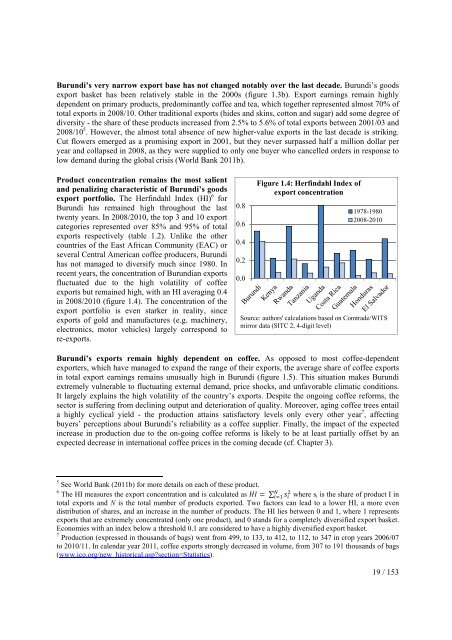
Burundi’s very narrow export base has not changed notably over the last decade. Burundi’s goodsexport basket has been relatively stable in the 2000s (figure 1.3b). Export earnings remain highlydependent on primary products, predominantly coffee and tea, which together represented almost 70% oftotal exports in 2008/10. Other traditional exports (hides and skins, cotton and sugar) add some degree ofdiversity - the share of these products increased from 2.5% to 5.6% of total exports between 2001/03 and2008/10 5 . However, the almost total absence of new higher-value exports in the last decade is striking.Cut flowers emerged as a promising export in 2001, but they never surpassed half a million dollar peryear and collapsed in 2008, as they were supplied to only one buyer who cancelled orders in response tolow demand during the global crisis (World Bank 2011b).Product concentration remains the most salientand penalizing characteristic of Burundi’s goodsexport portfolio. The Herfindahl Index (HI) 6 forBurundi has remained high throughout the lasttwenty years. In 2008/2010, the top 3 and 10 exportcategories represented over 85% and 95% of totalexports respectively (table 1.2). Unlike the othercountries of the East African Community (EAC) orseveral Central American coffee producers, Burundihas not managed to diversify much since 1980. Inrecent years, the concentration of Burundian exportsfluctuated due to the high volatility of coffeeexports but remained high, with an HI averaging 0.4in 2008/2010 (figure 1.4). The concentration of theexport portfolio is even starker in reality, sinceexports of gold and manufactures (e.g. machinery,electronics, motor vehicles) largely correspond tore-exports.0.80.60.40.20.0Figure 1.4: Herfindahl Index ofexport concentration1978-19802008-2010Source: authors' calculations based on Comtrade/WITSmirror data (SITC 2, 4-digit level)Burundi’s exports remain highly dependent on coffee. As opposed to most coffee-dependentexporters, which have managed to expand the range of their exports, the average share of coffee exportsin total export earnings remains unusually high in Burundi (figure 1.5). This situation makes Burundiextremely vulnerable to fluctuating external demand, price shocks, and unfavorable climatic conditions.It largely explains the high volatility of the country’s exports. Despite the ongoing coffee reforms, thesector is suffering from declining output and deterioration of quality. Moreover, aging coffee trees entaila highly cyclical yield - the production attains satisfactory levels only every other year 7 , affectingbuyers’ perceptions about Burundi’s reliability as a coffee supplier. Finally, the impact of the expectedincrease in production due to the on-going coffee reforms is likely to be at least partially offset by anexpected decrease in international coffee prices in the coming decade (cf. Chapter 3).5 See World Bank (2011b) for more details on each of these product.6 The HI measures the export concentration and is calculated as ∑ where s i is the share of product I intotal exports and N is the total number of products exported. Two factors can lead to a lower HI, a more evendistribution of shares, and an increase in the number of products. The HI lies between 0 and 1, where 1 representsexports that are extremely concentrated (only one product), and 0 stands for a completely diversified export basket.Economies with an index below a threshold 0.1 are considered to have a highly diversified export basket.7 Production (expressed in thousands of bags) went from 499, to 133, to 412, to 112, to 347 in crop years 2006/07to 2010/11. In calendar year 2011, coffee exports strongly decreased in volume, from 307 to 191 thousands of bags(www.ico.org/new_historical.asp?section=Statistics).19 / 153


