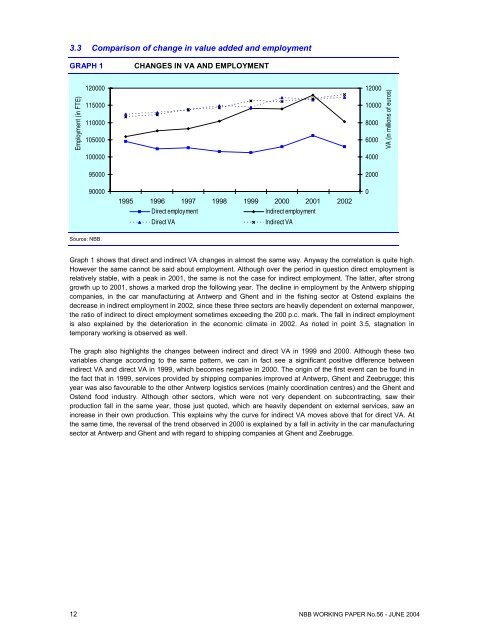
3.3 Comparison <strong>of</strong> change in value added and employmentGRAPH 1CHANGES IN VA AND EMPLOYMENTEmployment (in FTE)1200001150001100001050001000009500012000100008000600040002000VA (in millions <strong>of</strong> euros)900001995 1996 1997 1998 1999 2000 2001 <strong>2002</strong>Direct employmentIndirect employmentDirect VAIndirect VA0Source: NBB.Graph 1 shows that direct and indirect VA changes in almost <strong>the</strong> same way. Anyway <strong>the</strong> correlation is quite high.However <strong>the</strong> same cannot be said about employment. Although over <strong>the</strong> period in question direct employment isrelatively stable, with a peak in 2001, <strong>the</strong> same is not <strong>the</strong> case for indirect employment. The latter, after stronggrowth up to 2001, shows a marked drop <strong>the</strong> following year. The decline in employment by <strong>the</strong> Antwerp shippingcompanies, in <strong>the</strong> car manufacturing at Antwerp and Ghent and in <strong>the</strong> fishing sector at Ostend explains <strong>the</strong>decrease in indirect employment in <strong>2002</strong>, since <strong>the</strong>se three sectors are heavily dependent on external manpower,<strong>the</strong> ratio <strong>of</strong> indirect to direct employment sometimes exceeding <strong>the</strong> 200 p.c. mark. The fall in indirect employmentis also explained by <strong>the</strong> deterioration in <strong>the</strong> economic climate in <strong>2002</strong>. As noted in point 3.5, stagnation intemporary working is observed as well.The graph also highlights <strong>the</strong> changes between indirect and direct VA in 1999 and 2000. Although <strong>the</strong>se twovariables change according to <strong>the</strong> same pattern, we can in fact see a significant positive difference betweenindirect VA and direct VA in 1999, which becomes negative in 2000. The origin <strong>of</strong> <strong>the</strong> first event can be found in<strong>the</strong> fact that in 1999, services provided by shipping companies improved at Antwerp, Ghent and Zeebrugge; thisyear was also favourable to <strong>the</strong> o<strong>the</strong>r Antwerp logistics services (mainly coordination centres) and <strong>the</strong> Ghent andOstend food industry. Although o<strong>the</strong>r sectors, which were not very dependent on subcontracting, saw <strong>the</strong>irproduction fall in <strong>the</strong> same year, those just quoted, which are heavily dependent on external services, saw anincrease in <strong>the</strong>ir own production. This explains why <strong>the</strong> curve for indirect VA moves above that for direct VA. At<strong>the</strong> same time, <strong>the</strong> reversal <strong>of</strong> <strong>the</strong> trend observed in 2000 is explained by a fall in activity in <strong>the</strong> car manufacturingsector at Antwerp and Ghent and with regard to shipping companies at Ghent and Zeebrugge.12 NBB WORKING PAPER No.56 - JUNE 2004
3.4 Overall data on direct investmentThe study relates to tangible fixed assets at current prices as fixed assets realised in <strong>the</strong> course <strong>of</strong> <strong>the</strong> financialyear. Some corrections are made in <strong>the</strong> event <strong>of</strong> takeovers, as stated in <strong>the</strong> methodology (annex 1).TABLE 4INVESTMENT(millions <strong>of</strong> euros)1995 1996 1997 1998 1999 2000 2001 <strong>2002</strong> Relativeshare in<strong>2002</strong>(in p.c.)Changefrom 1995to <strong>2002</strong>(in p.c.)Annualaveragechange(in p.c.)Antwerp ................ 1,098.2 1,231.8 1,224.6 1,211.8 1,012.0 1,321.4 1,559.5 1,481.3 59.2 34.9 4.4Ghent.................... 331.4 447.4 385.3 430.5 659.0 600.3 629.8 802.4 32.0 142.1 13.5Ostend .................. 154.2 50.8 90.1 101.5 117.7 97.5 64.8 58.5 2.3 - 62.0 - 12.9Zeebrugge ............ 109.9 97.4 130.1 187.6 191.0 166.4 122.7 110.0 4.4 0.1 0.0Outside <strong>ports</strong> ........ 55.5 65.4 71.5 80.1 70.5 77.9 63.2 51.6 2.1 - 7.0 - 1.0Total investment. 1,749.2 1,892.8 1,901.5 2,011.5 2,050.3 2,263.5 2,440.0 2,503.8 100.0 43.1 5.3Source: NBB.For Antwerp, <strong>the</strong> year 2001 constitutes a peak for <strong>the</strong> period concerned, with investments exceeding 1.5 billioneuro (table 4). The upward trend, which began in 2000, seemed to be confirmed after a more modest year in1999. From 1995 to <strong>2002</strong>, <strong>the</strong> port <strong>of</strong> Ghent saw investments more than double (+ 142.1 p.c., i.e. + 13.5 p.c. asan annual average). At Antwerp, <strong>the</strong> amount <strong>of</strong> investment has increased by 4.4 p.c. per annum over <strong>the</strong> sameperiod. On <strong>the</strong> o<strong>the</strong>r hand, <strong>the</strong>re was stagnation at Zeebrugge (after several increases in 1997 and 1998, in <strong>2002</strong>it returned to <strong>the</strong> 1995 level) and a drop <strong>of</strong> 12.9 p.c. per annum at Ostend. In <strong>2002</strong>, investments at current pricesreached 2.5 billion euro for all <strong>ports</strong>, i.e. a rise <strong>of</strong> 2.6 p.c. in comparison to <strong>the</strong> previous year: this level was above<strong>the</strong> investment price index for <strong>2002</strong> (- 0.4 p.c. 29 ) This trend came from <strong>the</strong> port <strong>of</strong> Ghent, which recorded a rise <strong>of</strong>27.4 p.c. However, investments dropped in <strong>the</strong> o<strong>the</strong>r three <strong>ports</strong>: - 5.0 p.c. for Antwerp, - 9.6 p.c. for Ostendand - 10.4 p.c. for Zeebrugge. These developments are examined in detail in <strong>the</strong> next chapter.3.5 Overall data on <strong>the</strong> social balance sheet 30Since its introduction in 1996, <strong>the</strong> social balance sheet has <strong>of</strong>fered a consistent data set covering changes invarious aspects <strong>of</strong> company employment ranging from staff appointments and staff composition to employees’contractual status and qualifications, personnel costs, training policy and reasons for contract termination. As notall companies included in this study file <strong>the</strong>ir annual accounts based on <strong>the</strong> full presentation, <strong>the</strong> findings beloware not exhaustive. Indeed, <strong>the</strong> constant sample defined for <strong>the</strong> period from 2000 to <strong>2002</strong> groups toge<strong>the</strong>r 1,555companies, which is slightly less than half <strong>of</strong> <strong>the</strong> total population considered in this study (3,147 companies in<strong>2002</strong>). Comments focus on <strong>the</strong> changes that took place during <strong>the</strong> last three years. The <strong>2002</strong> figures are given ingreater detail, by sector, in annex 7.2930Source: Belgostat online (http://www.belgostat.be)The national data given in point 3.5 are taken from <strong>the</strong> Social Balance Sheet <strong>2002</strong> (NBB, <strong>Economic</strong> Review 2003/4). Theresults given here relate to a constant sample and are aggregated for all <strong>of</strong> <strong>the</strong> <strong>ports</strong>.NBB WORKING PAPER No. 56 - JUNE 2004 13