

Economic importance of the Flemish maritime ports: Report 2002
Economic importance of the Flemish maritime ports: Report 2002
Economic importance of the Flemish maritime ports: Report 2002

Create successful ePaper yourself
Turn your PDF publications into a flip-book with our unique Google optimized e-Paper software.
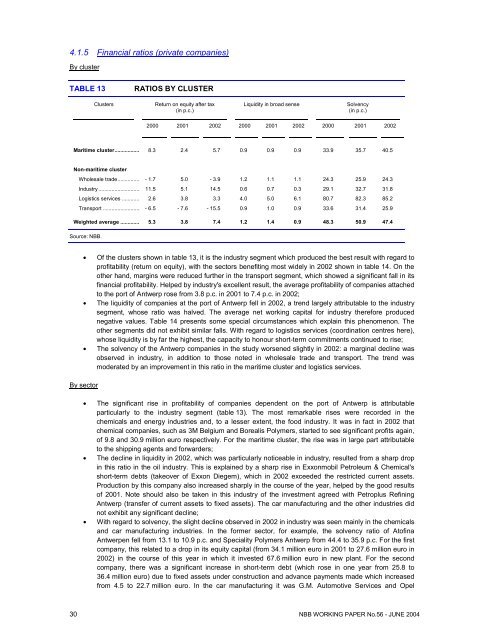
4.1.5 Financial ratios (private companies)By clusterTABLE 13RATIOS BY CLUSTERClustersReturn on equity after tax(in p.c.)Liquidity in broad senseSolvency(in p.c.)2000 2001 <strong>2002</strong> 2000 2001 <strong>2002</strong> 2000 2001 <strong>2002</strong>Maritime cluster................. 8.3 2.4 5.7 0.9 0.9 0.9 33.9 35.7 40.5Non-<strong>maritime</strong> clusterWholesale trade............... - 1.7 5.0 - 3.9 1.2 1.1 1.1 24.3 25.9 24.3Industry ............................ 11.5 5.1 14.5 0.6 0.7 0.3 29.1 32.7 31.8Logistics services ............ 2.6 3.8 3.3 4.0 5.0 6.1 80.7 82.3 85.2Transport ......................... - 6.5 - 7.6 - 15.5 0.9 1.0 0.9 33.6 31.4 25.9Weighted average ............. 5.3 3.8 7.4 1.2 1.4 0.9 48.3 50.9 47.4Source: NBB.• Of <strong>the</strong> clusters shown in table 13, it is <strong>the</strong> industry segment which produced <strong>the</strong> best result with regard topr<strong>of</strong>itability (return on equity), with <strong>the</strong> sectors benefiting most widely in <strong>2002</strong> shown in table 14. On <strong>the</strong>o<strong>the</strong>r hand, margins were reduced fur<strong>the</strong>r in <strong>the</strong> transport segment, which showed a significant fall in itsfinancial pr<strong>of</strong>itability. Helped by industry's excellent result, <strong>the</strong> average pr<strong>of</strong>itability <strong>of</strong> companies attachedto <strong>the</strong> port <strong>of</strong> Antwerp rose from 3.8 p.c. in 2001 to 7.4 p.c. in <strong>2002</strong>;• The liquidity <strong>of</strong> companies at <strong>the</strong> port <strong>of</strong> Antwerp fell in <strong>2002</strong>, a trend largely attributable to <strong>the</strong> industrysegment, whose ratio was halved. The average net working capital for industry <strong>the</strong>refore producednegative values. Table 14 presents some special circumstances which explain this phenomenon. Theo<strong>the</strong>r segments did not exhibit similar falls. With regard to logistics services (coordination centres here),whose liquidity is by far <strong>the</strong> highest, <strong>the</strong> capacity to honour short-term commitments continued to rise;• The solvency <strong>of</strong> <strong>the</strong> Antwerp companies in <strong>the</strong> study worsened slightly in <strong>2002</strong>: a marginal decline wasobserved in industry, in addition to those noted in wholesale trade and transport. The trend wasmoderated by an improvement in this ratio in <strong>the</strong> <strong>maritime</strong> cluster and logistics services.By sector• The significant rise in pr<strong>of</strong>itability <strong>of</strong> companies dependent on <strong>the</strong> port <strong>of</strong> Antwerp is attributableparticularly to <strong>the</strong> industry segment (table 13). The most remarkable rises were recorded in <strong>the</strong>chemicals and energy industries and, to a lesser extent, <strong>the</strong> food industry. It was in fact in <strong>2002</strong> thatchemical companies, such as 3M Belgium and Borealis Polymers, started to see significant pr<strong>of</strong>its again,<strong>of</strong> 9.8 and 30.9 million euro respectively. For <strong>the</strong> <strong>maritime</strong> cluster, <strong>the</strong> rise was in large part attributableto <strong>the</strong> shipping agents and forwarders;• The decline in liquidity in <strong>2002</strong>, which was particularly noticeable in industry, resulted from a sharp dropin this ratio in <strong>the</strong> oil industry. This is explained by a sharp rise in Exxonmobil Petroleum & Chemical'sshort-term debts (takeover <strong>of</strong> Exxon Diegem), which in <strong>2002</strong> exceeded <strong>the</strong> restricted current assets.Production by this company also increased sharply in <strong>the</strong> course <strong>of</strong> <strong>the</strong> year, helped by <strong>the</strong> good results<strong>of</strong> 2001. Note should also be taken in this industry <strong>of</strong> <strong>the</strong> investment agreed with Petroplus RefiningAntwerp (transfer <strong>of</strong> current assets to fixed assets). The car manufacturing and <strong>the</strong> o<strong>the</strong>r industries didnot exhibit any significant decline;• With regard to solvency, <strong>the</strong> slight decline observed in <strong>2002</strong> in industry was seen mainly in <strong>the</strong> chemicalsand car manufacturing industries. In <strong>the</strong> former sector, for example, <strong>the</strong> solvency ratio <strong>of</strong> At<strong>of</strong>inaAntwerpen fell from 13.1 to 10.9 p.c. and Speciality Polymers Antwerp from 44.4 to 35.9 p.c. For <strong>the</strong> firstcompany, this related to a drop in its equity capital (from 34.1 million euro in 2001 to 27.6 million euro in<strong>2002</strong>) in <strong>the</strong> course <strong>of</strong> this year in which it invested 67.6 million euro in new plant. For <strong>the</strong> secondcompany, <strong>the</strong>re was a significant increase in short-term debt (which rose in one year from 25.8 to36.4 million euro) due to fixed assets under construction and advance payments made which increasedfrom 4.5 to 22.7 million euro. In <strong>the</strong> car manufacturing it was G.M. Automotive Services and Opel30 NBB WORKING PAPER No.56 - JUNE 2004


