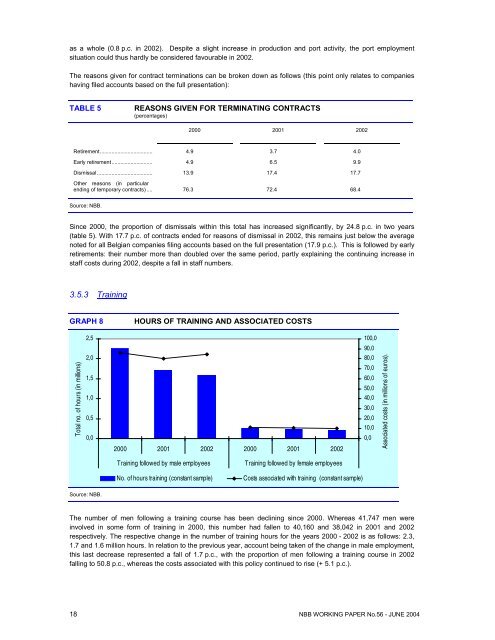
as a whole (0.8 p.c. in <strong>2002</strong>). Despite a slight increase in production and port activity, <strong>the</strong> port employmentsituation could thus hardly be considered favourable in <strong>2002</strong>.The reasons given for contract terminations can be broken down as follows (this point only relates to companieshaving filed accounts based on <strong>the</strong> full presentation):TABLE 5REASONS GIVEN FOR TERMINATING CONTRACTS(percentages)2000 2001 <strong>2002</strong>Retirement.................................... 4.9 3.7 4.0Early retirement............................ 4.9 6.5 9.9Dismissal ...................................... 13.9 17.4 17.7O<strong>the</strong>r reasons (in particularending <strong>of</strong> temporary contracts) .... 76.3 72.4 68.4Source: NBB.Since 2000, <strong>the</strong> proportion <strong>of</strong> dismissals within this total has increased significantly, by 24.8 p.c. in two years(table 5). With 17.7 p.c. <strong>of</strong> contracts ended for reasons <strong>of</strong> dismissal in <strong>2002</strong>, this remains just below <strong>the</strong> averagenoted for all Belgian companies filing accounts based on <strong>the</strong> full presentation (17.9 p.c.). This is followed by earlyretirements: <strong>the</strong>ir number more than doubled over <strong>the</strong> same period, partly explaining <strong>the</strong> continuing increase instaff costs during <strong>2002</strong>, despite a fall in staff numbers.3.5.3 TrainingGRAPH 8HOURS OF TRAINING AND ASSOCIATED COSTS2,5100,090,0Total no. <strong>of</strong> hours (in millions)2,01,51,00,50,02000 2001 <strong>2002</strong> 2000 2001 <strong>2002</strong>80,070,060,050,040,030,020,010,00,0Associated costs (in millions <strong>of</strong> euros).Training followed by male employeesNo. <strong>of</strong> hours training (constant sample)Training followed by female employeesCosts associated with training (constant sample)Source: NBB.The number <strong>of</strong> men following a training course has been declining since 2000. Whereas 41,747 men wereinvolved in some form <strong>of</strong> training in 2000, this number had fallen to 40,160 and 38,042 in 2001 and <strong>2002</strong>respectively. The respective change in <strong>the</strong> number <strong>of</strong> training hours for <strong>the</strong> years 2000 - <strong>2002</strong> is as follows: 2.3,1.7 and 1.6 million hours. In relation to <strong>the</strong> previous year, account being taken <strong>of</strong> <strong>the</strong> change in male employment,this last decrease represented a fall <strong>of</strong> 1.7 p.c., with <strong>the</strong> proportion <strong>of</strong> men following a training course in <strong>2002</strong>falling to 50.8 p.c., whereas <strong>the</strong> costs associated with this policy continued to rise (+ 5.1 p.c.).18 NBB WORKING PAPER No.56 - JUNE 2004
More women participated in training sessions during <strong>2002</strong> (+ 1.1 p.c.), <strong>the</strong> number involved being 6,573, or48.9 p.c. <strong>of</strong> <strong>the</strong> total number <strong>of</strong> female employees. In 2000 and 2001, <strong>the</strong> number <strong>of</strong> female employees involvedwas 6,019 and 6,479 respectively. The gap is thus gradually being closed with <strong>the</strong> men, even though a certain fallin number <strong>of</strong> hours devoted to <strong>the</strong>ir training could be noted: 0.3 million hours in 2000 and 0.2 million hours in 2001and <strong>2002</strong>. Training sessions were thus more frequent but shorter. A slight drop in associated costs incurred bycompanies in <strong>2002</strong> was also noted (- 4.8 p.c., graph 8).The proportion <strong>of</strong> hours devoted to training in relation to <strong>the</strong> total number <strong>of</strong> hours worked - for both men andwomen - fell from 1.42 p.c. in 2001 to 1.32 p.c. in <strong>2002</strong>, a level which remained above <strong>the</strong> national average(0.90 p.c. recorded in <strong>2002</strong>). In spite <strong>of</strong> <strong>the</strong> difficulties encountered in terms <strong>of</strong> employment, companies that relyon <strong>the</strong> <strong>ports</strong> are maintaining <strong>the</strong>ir staff training efforts, particularly with regard to women, whilst endeavouring tolimit costs. This is particularly <strong>the</strong> case in <strong>the</strong> following sectors: o<strong>the</strong>r services, <strong>the</strong> electronics and oil industrieswhere more workers are spending time training.In cargo handling, too, <strong>the</strong>re would seem to be an effort to broaden, update and improve workers’ qualifications.This translates into a dynamic human resources policy and lifelong training efforts. This will cannot yet be seen,however, in <strong>the</strong> <strong>2002</strong> figures.3.6 Overall data on <strong>the</strong> financial situationThe financial ratios are aggregated by port and compared to levels recorded for <strong>the</strong> economy as a whole (nonfinancialcompanies). The detailed results by port are presented in chapter 4.The trend over <strong>the</strong> last three years under review is as follows:TABLE 6SUMMARY OF FINANCIAL RATIOS BY PORTPortsReturn on equity after tax(in p.c.)Liquidity in broad senseSolvency(in p.c.)2000 2001 <strong>2002</strong> 2000 2001 <strong>2002</strong> 2000 2001 <strong>2002</strong>Antwerp................ 5.3 3.8 7.4 1.2 1.4 0.9 48.3 50.9 47.4Ghent ................... 8.9 3.3 - 7.6 1.1 1.0 0.9 47.0 46.2 41.8Ostend ................. 4.4 7.2 7.0 1.1 1.2 1.2 32.1 33.7 36.1Zeebrugge............ 5.5 5.9 2.8 1.2 1.2 1.3 37.6 43.4 45.2Total Ports .......... 6.2 3.8 4.5 1.2 1.2 0.9 47.1 48.9 46.0Non-financialcompanies .......... 9.4 5.0 2.7 1.1 1.2 1.2 42.9 45.9 45.7Source: NBB.The same method is used to calculate <strong>the</strong> ratios for <strong>the</strong> <strong>ports</strong> and for non-financial companies as a whole, i.e.aggregation. This method differs somewhat from that used by <strong>the</strong> end <strong>of</strong> 2003 in <strong>the</strong> <strong>Economic</strong> Review 35 .• Although <strong>the</strong> pr<strong>of</strong>itability <strong>of</strong> Belgian non-financial companies almost halved in <strong>2002</strong>, that <strong>of</strong> all <strong>the</strong> <strong>ports</strong>under review increased slightly, with <strong>the</strong> exception <strong>of</strong> Zeebrugge and Ghent. The strongest growth wasnoted at Antwerp port, where <strong>the</strong> average ratio in <strong>2002</strong> was more than 2.5 times that <strong>of</strong> non-financialcompanies as a whole, due particularly to good performance on <strong>the</strong> part <strong>of</strong> <strong>the</strong> chemicals and energyindustries (see chapter 4). From 2000 to <strong>2002</strong>, pr<strong>of</strong>itability fell rapidly at Ghent port and turned negative, dueto bad results in <strong>the</strong> metal-working industry. At Zeebrugge, it was <strong>the</strong> metal-working and electronicsindustries that primarily pushed down pr<strong>of</strong>itability;• In <strong>2002</strong>, <strong>the</strong> liquidity ratio was less than 80 p.c. that <strong>of</strong> non-financial companies. The Antwerp oil industry’scash position explains this development and, to a lesser extent, that <strong>of</strong> logistics services at Ghent. For <strong>the</strong><strong>ports</strong> <strong>of</strong> Ostend and Zeebrugge, liquidity was above that <strong>of</strong> <strong>the</strong> economy as a whole, due to a reduction in<strong>the</strong> short-term debts <strong>of</strong> services in <strong>the</strong> former and in <strong>the</strong> electronics industry in <strong>the</strong> latter;35In <strong>the</strong> chapter on non-financial companies’ results in <strong>2002</strong> (NBB, <strong>Economic</strong> Review 2003/4), <strong>the</strong> median ratio method isused.NBB WORKING PAPER No. 56 - JUNE 2004 19