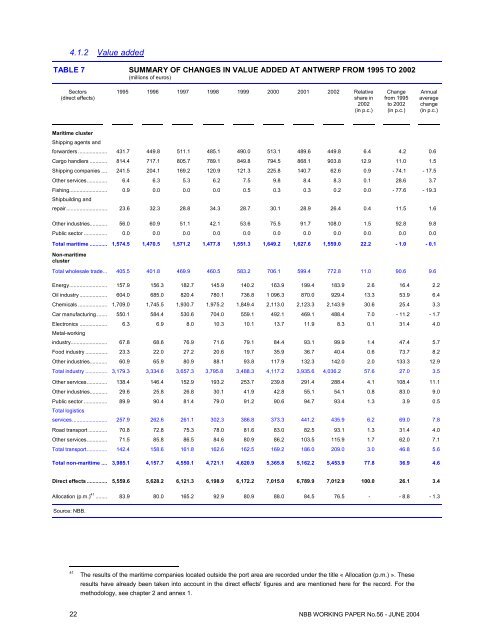
4.1.2 Value addedTABLE 7 SUMMARY OF CHANGES IN VALUE ADDED AT ANTWERP FROM 1995 TO <strong>2002</strong>(millions <strong>of</strong> euros)Sectors(direct effects)1995 1996 1997 1998 1999 2000 2001 <strong>2002</strong> Relativeshare in<strong>2002</strong>(in p.c.)Changefrom 1995to <strong>2002</strong>(in p.c.)Annualaveragechange(in p.c.)Maritime clusterShipping agents andforwarders .................... 431.7 449.8 511.1 485.1 490.0 513.1 489.6 449.8 6.4 4.2 0.6Cargo handlers ............ 814.4 717.1 805.7 789.1 849.8 794.5 868.1 903.8 12.9 11.0 1.5Shipping companies .... 241.5 204.1 169.2 120.9 121.3 225.8 140.7 62.6 0.9 - 74.1 - 17.5O<strong>the</strong>r services.............. 6.4 6.3 5.3 6.2 7.5 9.8 8.4 8.3 0.1 28.6 3.7Fishing.......................... 0.9 0.0 0.0 0.0 0.5 0.3 0.3 0.2 0.0 - 77.6 - 19.3Shipbuilding andrepair............................ 23.6 32.3 28.8 34.3 28.7 30.1 28.9 26.4 0.4 11.5 1.6O<strong>the</strong>r industries............ 56.0 60.9 51.1 42.1 53.6 75.5 91.7 108.0 1.5 92.8 9.8Public sector ................ 0.0 0.0 0.0 0.0 0.0 0.0 0.0 0.0 0.0 0.0 0.0Total <strong>maritime</strong> ............ 1,574.5 1,470.5 1,571.2 1,477.8 1,551.3 1,649.2 1,627.6 1,559.0 22.2 - 1.0 - 0.1Non-<strong>maritime</strong>clusterTotal wholesale trade... 405.5 401.8 469.9 460.5 583.2 706.1 599.4 772.8 11.0 90.6 9.6Energy.......................... 157.9 156.3 182.7 145.9 140.2 163.9 199.4 183.9 2.6 16.4 2.2Oil industry ................... 604.0 685.0 820.4 780.1 736.8 1 096.3 870.0 929.4 13.3 53.9 6.4Chemicals .................... 1,709.0 1,745.5 1,930.7 1,975.2 1,849.4 2,113.0 2,123.3 2,143.9 30.6 25.4 3.3Car manufacturing ....... 550.1 584.4 530.6 704.0 559.1 492.1 469.1 488.4 7.0 - 11.2 - 1.7Electronics ................... 6.3 6.9 8.0 10.3 10.1 13.7 11.9 8.3 0.1 31.4 4.0Metal-workingindustry......................... 67.8 68.6 76.9 71.6 79.1 84.4 93.1 99.9 1.4 47.4 5.7Food industry ............... 23.3 22.0 27.2 20.6 19.7 35.9 36.7 40.4 0.6 73.7 8.2O<strong>the</strong>r industries............ 60.9 65.9 80.9 88.1 93.8 117.9 132.3 142.0 2.0 133.3 12.9Total industry ............... 3,179.3 3,334.6 3,657.3 3,795.8 3,488.3 4,117.2 3,935.6 4,036.2 57.6 27.0 3.5O<strong>the</strong>r services.............. 138.4 146.4 152.9 193.2 253.7 239.8 291.4 288.4 4.1 108.4 11.1O<strong>the</strong>r industries............ 29.6 25.8 26.8 30.1 41.9 42.8 55.1 54.1 0.8 83.0 9.0Public sector ................ 89.9 90.4 81.4 79.0 91.2 90.6 94.7 93.4 1.3 3.9 0.5Total logisticsservices........................ 257.9 262.6 261.1 302.3 386.8 373.3 441.2 435.9 6.2 69.0 7.8Road transport ............. 70.8 72.8 75.3 78.0 81.6 83.0 82.5 93.1 1.3 31.4 4.0O<strong>the</strong>r services.............. 71.5 85.8 86.5 84.6 80.9 86.2 103.5 115.9 1.7 62.0 7.1Total transport.............. 142.4 158.6 161.8 162.6 162.5 169.2 186.0 209.0 3.0 46.8 5.6Total non-<strong>maritime</strong> .... 3,985.1 4,157.7 4,550.1 4,721.1 4,620.9 5,365.8 5,162.2 5,453.9 77.8 36.9 4.6Direct effects .............. 5,559.6 5,628.2 6,121.3 6,198.9 6,172.2 7,015.0 6,789.9 7,012.9 100.0 26.1 3.4Allocation (p.m.) 41 ........ 83.9 80.0 165.2 92.9 80.9 88.0 84.5 76.5 - - 8.8 - 1.3Source: NBB.41The results <strong>of</strong> <strong>the</strong> <strong>maritime</strong> companies located outside <strong>the</strong> port area are recorded under <strong>the</strong> title « Allocation (p.m.) ». Theseresults have already been taken into account in <strong>the</strong> direct effects' figures and are mentioned here for <strong>the</strong> record. For <strong>the</strong>methodology, see chapter 2 and annex 1.22 NBB WORKING PAPER No.56 - JUNE 2004
TABLE 7 SUMMARY OF CHANGES IN VALUE ADDED AT ANTWERP FROM 1995 TO <strong>2002</strong>(continued)(millions <strong>of</strong> euros)Sectors:indirect effects 42 1995 1996 1997 1998 1999 2000 2001 <strong>2002</strong> Relativeshare in<strong>2002</strong>(in p.c.)Changefrom 1995to <strong>2002</strong>(in p.c.)Annualaveragechange(in p.c.)Total <strong>maritime</strong> ..... 2,267.6 2,192.8 2,511.6 2,086.7 2,228.7 2,152.0 2,126.9 2,031.8 29.1 - 10.4 - 1.6Total non<strong>maritime</strong>............... 3,320.9 3,541.1 3,812.6 4,126.8 4,352.9 4,461.7 4,543.4 4,950.8 70.9 49.1 5.9Indirect effects .... 5,588.4 5,733.9 6,324.2 6,213.6 6,581.5 6,613.7 6,670.3 6,982.6 100.0 24.9 3.2Total valueadded.................... 11,148.0 11,362.1 12,445.5 12,412.5 12,753.7 13,628.7 13,460.1 13,995.5 - 25.5 3.3Source: BNB.General changesFrom 1995 to <strong>2002</strong>, <strong>the</strong> direct VA for <strong>the</strong> port <strong>of</strong> Antwerp (including allocation) grew by 26.1 p.c., with an annualaverage <strong>of</strong> 3.4 p.c. (table 7). This figure reaches 25.5 p.c. and 3.3 p.c. as an annual average if indirect VA isincluded. The rise in total VA is <strong>the</strong>refore due both to <strong>the</strong> companies in <strong>the</strong> sample and to subcontractingoperations, in very similar proportions. The largest increase in total VA (direct, including allocation, and indirect)was recorded in 1997 with growth <strong>of</strong> 9.5 p.c. The strongest growth in direct VA (+ 13.7 p.c.) was seen in 2000.The sharpest drop was recorded in 2001 with a fall <strong>of</strong> 3.2 p.c. in direct VA, i.e. 1.2 p.c. in total. A feature <strong>of</strong> <strong>the</strong>year <strong>2002</strong> was <strong>the</strong> return to growth in <strong>the</strong> port <strong>of</strong> Antwerp where <strong>the</strong> total VA rose by 4.0 p.c. while direct VA wasup by 3.3 p.c. In <strong>the</strong> same year, direct VA in <strong>the</strong> port <strong>of</strong> Antwerp amounted to 7.0 billion euro and 14.0 billion euroif indirect effects are added.From <strong>the</strong> point <strong>of</strong> view <strong>of</strong> production, <strong>the</strong> ratio <strong>of</strong> indirect VA to direct VA reached a peak in 1999 at 106.6 p.c.,due to <strong>the</strong> growth seen particularly in production by shipping companies, a sector strongly dependent on externallabour. This ratio fell back again in 2000 (drop in production in <strong>the</strong> car manufacturing) and amounted to 99.6 p.c.in <strong>2002</strong>.Changes by cluster in direct effectsThe <strong>maritime</strong> cluster occupies an important position in <strong>the</strong> direct VA at <strong>the</strong> port <strong>of</strong> Antwerp (24.7 p.c. on averageover <strong>the</strong> period 1995 - <strong>2002</strong>). Over this period, <strong>the</strong> sharpest drop was recorded in 1996 with a fall <strong>of</strong> 6.6 p.c. Thenon-<strong>maritime</strong> industry segment represents <strong>the</strong> largest percentage <strong>of</strong> production at <strong>the</strong> port <strong>of</strong> Antwerp (58.5 p.c.);its most significant rise was recorded in 2000 (+ 18.0 p.c.). The VA for this segment improved on average by3.5 p.c. per annum from 1995 to <strong>2002</strong>. The non-<strong>maritime</strong> wholesale trade segment improved by 9.6 p.c. perannum for direct VA and recorded its largest increase in 1999 (+ 26.7 p.c.) and in <strong>2002</strong> (+ 28.9 p.c.). The VA for<strong>the</strong> non-<strong>maritime</strong> logistics services and transport segments rose on average by 7.8 p.c. and 5.6 p.c. per annumrespectively. In <strong>2002</strong>, <strong>the</strong> wholesale trade and transport segments recorded <strong>the</strong>ir greatest improvements withrises in VA <strong>of</strong> 28.9 p.c. and 12.4 p.c. respectively. The reasons for this are touched on below.Changes by sector in direct effectsChemicals (30.9 p.c. on average <strong>of</strong> <strong>the</strong> VA in <strong>the</strong> port) and, to a lesser extent, <strong>the</strong> car manufacturing, o<strong>the</strong>rservices, cargo handling, oil industry and shipping agents and forwarders constitute <strong>the</strong> main part <strong>of</strong> <strong>the</strong> VAproduced at <strong>the</strong> port <strong>of</strong> Antwerp (table 7). The most significant rise was recorded in 1997 (+ 8.8 p.c.), a year inwhich chemicals production saw its second strongest growth (+ 10.6 p.c.).The year <strong>2002</strong> was favourable for most <strong>of</strong> <strong>the</strong> sectors.At <strong>the</strong> port <strong>of</strong> Antwerp, <strong>the</strong> major changes recorded in <strong>2002</strong> for <strong>the</strong> direct VA in <strong>the</strong> main sectors were as follows:• Chemicals gained 1.0 p.c. to reach 2.1 billion euro. In <strong>2002</strong>, this rise was explained in part by <strong>the</strong> increase <strong>of</strong>11 p.c. in production at Degussa, which brought <strong>the</strong> new Oxeno unit into service for dibutene production. Inaddition, BASF opened a new factory on its site for <strong>the</strong> production <strong>of</strong> <strong>the</strong> super absorbent polymer, SAP, anddecided to build a factory to manufacture ABS materials: this was in spite <strong>of</strong> a slight fall in production(- 0.3 p.c. <strong>the</strong> same year); Air Liquide, whose production level remained exactly <strong>the</strong> same as in 2001,announced <strong>the</strong> construction <strong>of</strong> a new wet goods factory on BASF land;42The breakdown <strong>of</strong> <strong>the</strong> indirect effects by sector for <strong>the</strong> period 1995 - 1999 can be found in annex 5 (table 49).NBB WORKING PAPER No. 56 - JUNE 2004 23