

Economic importance of the Flemish maritime ports: Report 2002
Economic importance of the Flemish maritime ports: Report 2002
Economic importance of the Flemish maritime ports: Report 2002

Create successful ePaper yourself
Turn your PDF publications into a flip-book with our unique Google optimized e-Paper software.
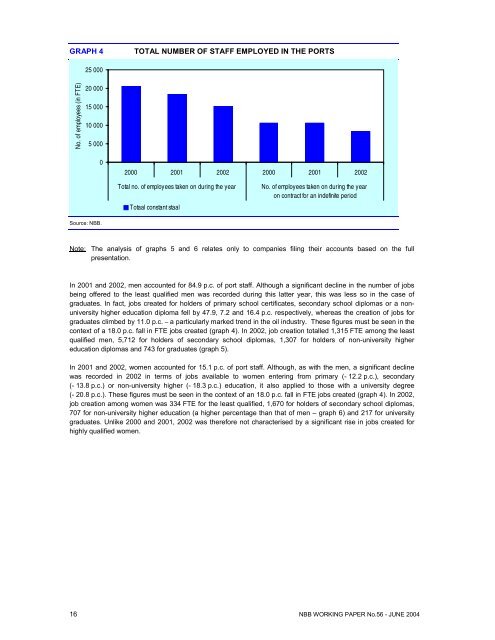
GRAPH 4TOTAL NUMBER OF STAFF EMPLOYED IN THE PORTS25 000No. <strong>of</strong> employees (in FTE)20 00015 00010 0005 00002000 2001 <strong>2002</strong> 2000 2001 <strong>2002</strong>Total no. <strong>of</strong> employees taken on during <strong>the</strong> yearTotaal constant staalNo. <strong>of</strong> employees taken on during <strong>the</strong> yearon contract for an indefinite periodSource: NBB.Note: The analysis <strong>of</strong> graphs 5 and 6 relates only to companies filing <strong>the</strong>ir accounts based on <strong>the</strong> fullpresentation.In 2001 and <strong>2002</strong>, men accounted for 84.9 p.c. <strong>of</strong> port staff. Although a significant decline in <strong>the</strong> number <strong>of</strong> jobsbeing <strong>of</strong>fered to <strong>the</strong> least qualified men was recorded during this latter year, this was less so in <strong>the</strong> case <strong>of</strong>graduates. In fact, jobs created for holders <strong>of</strong> primary school certificates, secondary school diplomas or a nonuniversityhigher education diploma fell by 47.9, 7.2 and 16.4 p.c. respectively, whereas <strong>the</strong> creation <strong>of</strong> jobs forgraduates climbed by 11.0 p.c. – a particularly marked trend in <strong>the</strong> oil industry. These figures must be seen in <strong>the</strong>context <strong>of</strong> a 18.0 p.c. fall in FTE jobs created (graph 4). In <strong>2002</strong>, job creation totalled 1,315 FTE among <strong>the</strong> leastqualified men, 5,712 for holders <strong>of</strong> secondary school diplomas, 1,307 for holders <strong>of</strong> non-university highereducation diplomas and 743 for graduates (graph 5).In 2001 and <strong>2002</strong>, women accounted for 15.1 p.c. <strong>of</strong> port staff. Although, as with <strong>the</strong> men, a significant declinewas recorded in <strong>2002</strong> in terms <strong>of</strong> jobs available to women entering from primary (- 12.2 p.c.), secondary(- 13.8 p.c.) or non-university higher (- 18.3 p.c.) education, it also applied to those with a university degree(- 20.8 p.c.). These figures must be seen in <strong>the</strong> context <strong>of</strong> an 18.0 p.c. fall in FTE jobs created (graph 4). In <strong>2002</strong>,job creation among women was 334 FTE for <strong>the</strong> least qualified, 1,670 for holders <strong>of</strong> secondary school diplomas,707 for non-university higher education (a higher percentage than that <strong>of</strong> men – graph 6) and 217 for universitygraduates. Unlike 2000 and 2001, <strong>2002</strong> was <strong>the</strong>refore not characterised by a significant rise in jobs created forhighly qualified women.16 NBB WORKING PAPER No.56 - JUNE 2004


