

Economic importance of the Flemish maritime ports: Report 2002
Economic importance of the Flemish maritime ports: Report 2002
Economic importance of the Flemish maritime ports: Report 2002

Create successful ePaper yourself
Turn your PDF publications into a flip-book with our unique Google optimized e-Paper software.
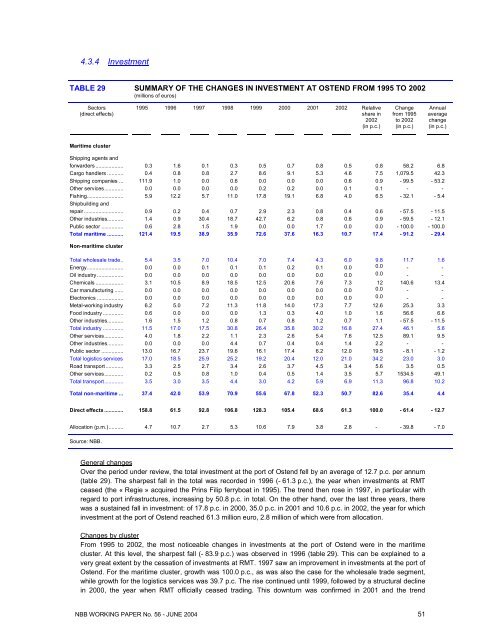
4.3.4 InvestmentTABLE 29 SUMMARY OF THE CHANGES IN INVESTMENT AT OSTEND FROM 1995 TO <strong>2002</strong>(millions <strong>of</strong> euros)Sectors(direct effects)1995 1996 1997 1998 1999 2000 2001 <strong>2002</strong> Relativeshare in<strong>2002</strong>(in p.c.)Changefrom 1995to <strong>2002</strong>(in p.c.)Annualaveragechange(in p.c.)Maritime clusterShipping agents andforwarders ................... 0.3 1.6 0.1 0.3 0.5 0.7 0.8 0.5 0.8 58.2 6.8Cargo handlers ........... 0.4 0.8 0.8 2.7 8.6 9.1 5.3 4.6 7.5 1,079.5 42.3Shipping companies ... 111.9 1.0 0.0 0.6 0.0 0.0 0.0 0.6 0.9 - 99.5 - 53.2O<strong>the</strong>r services............. 0.0 0.0 0.0 0.0 0.2 0.2 0.0 0.1 0.1 - -Fishing......................... 5.9 12.2 5.7 11.0 17.8 19.1 6.8 4.0 6.5 - 32.1 - 5.4Shipbuilding andrepair........................... 0.9 0.2 0.4 0.7 2.9 2.3 0.8 0.4 0.6 - 57.5 - 11.5O<strong>the</strong>r industries........... 1.4 0.9 30.4 18.7 42.7 6.2 0.8 0.6 0.9 - 59.5 - 12.1Public sector ............... 0.6 2.8 1.5 1.9 0.0 0.0 1.7 0.0 0.0 - 100.0 - 100.0Total <strong>maritime</strong> ........... 121.4 19.5 38.9 35.9 72.6 37.6 16.3 10.7 17.4 - 91.2 - 29.4Non-<strong>maritime</strong> clusterTotal wholesale trade.. 5.4 3.5 7.0 10.4 7.0 7.4 4.3 6.0 9.8 11.7 1.6Energy......................... 0.0 0.0 0.1 0.1 0.1 0.2 0.1 0.0 0.0 - -Oil industry .................. 0.0 0.0 0.0 0.0 0.0 0.0 0.0 0.0 0.0 - -Chemicals ................... 3.1 10.5 8.9 18.5 12.5 20.6 7.6 7.3 12 140.6 13.4Car manufacturing ...... 0.0 0.0 0.0 0.0 0.0 0.0 0.0 0.0 0.0 - -Electronics .................. 0.0 0.0 0.0 0.0 0.0 0.0 0.0 0.0 0.0 - -Metal-working industry 6.2 5.0 7.2 11.3 11.8 14.0 17.3 7.7 12.6 25.3 3.3Food industry .............. 0.6 0.0 0.0 0.0 1.3 0.3 4.0 1.0 1.6 56.6 6.6O<strong>the</strong>r industries........... 1.6 1.5 1.2 0.8 0.7 0.8 1.2 0.7 1.1 - 57.5 - 11.5Total industry .............. 11.5 17.0 17.5 30.8 26.4 35.8 30.2 16.8 27.4 46.1 5.6O<strong>the</strong>r services............. 4.0 1.8 2.2 1.1 2.3 2.6 5.4 7.6 12.5 89.1 9.5O<strong>the</strong>r industries........... 0.0 0.0 0.0 4.4 0.7 0.4 0.4 1.4 2.2 - -Public sector ............... 13.0 16.7 23.7 19.6 16.1 17.4 6.2 12.0 19.5 - 8.1 - 1.2Total logistics services 17.0 18.5 25.9 25.2 19.2 20.4 12.0 21.0 34.2 23.0 3.0Road transport ............ 3.3 2.5 2.7 3.4 2.6 3.7 4.5 3.4 5.6 3.5 0.5O<strong>the</strong>r services............. 0.2 0.5 0.8 1.0 0.4 0.5 1.4 3.5 5.7 1534.5 49.1Total transport............. 3.5 3.0 3.5 4.4 3.0 4.2 5.9 6.9 11.3 96.8 10.2Total non-<strong>maritime</strong> ... 37.4 42.0 53.9 70.9 55.6 67.8 52.3 50.7 82.6 35.4 4.4Direct effects ............. 158.8 61.5 92.8 106.8 128.3 105.4 68.6 61.3 100.0 - 61.4 - 12.7Allocation (p.m.).......... 4.7 10.7 2.7 5.3 10.6 7.9 3.8 2.8 - - 39.8 - 7.0Source: NBB.General changesOver <strong>the</strong> period under review, <strong>the</strong> total investment at <strong>the</strong> port <strong>of</strong> Ostend fell by an average <strong>of</strong> 12.7 p.c. per annum(table 29). The sharpest fall in <strong>the</strong> total was recorded in 1996 (- 61.3 p.c.), <strong>the</strong> year when investments at RMTceased (<strong>the</strong> « Regie » acquired <strong>the</strong> Prins Filip ferryboat in 1995). The trend <strong>the</strong>n rose in 1997, in particular withregard to port infrastructures, increasing by 50.8 p.c. in total. On <strong>the</strong> o<strong>the</strong>r hand, over <strong>the</strong> last three years, <strong>the</strong>rewas a sustained fall in investment: <strong>of</strong> 17.8 p.c. in 2000, 35.0 p.c. in 2001 and 10.6 p.c. in <strong>2002</strong>, <strong>the</strong> year for whichinvestment at <strong>the</strong> port <strong>of</strong> Ostend reached 61.3 million euro, 2.8 million <strong>of</strong> which were from allocation.Changes by clusterFrom 1995 to <strong>2002</strong>, <strong>the</strong> most noticeable changes in investments at <strong>the</strong> port <strong>of</strong> Ostend were in <strong>the</strong> <strong>maritime</strong>cluster. At this level, <strong>the</strong> sharpest fall (- 83.9 p.c.) was observed in 1996 (table 29). This can be explained to avery great extent by <strong>the</strong> cessation <strong>of</strong> investments at RMT. 1997 saw an improvement in investments at <strong>the</strong> port <strong>of</strong>Ostend. For <strong>the</strong> <strong>maritime</strong> cluster, growth was 100.0 p.c., as was also <strong>the</strong> case for <strong>the</strong> wholesale trade segment,while growth for <strong>the</strong> logistics services was 39.7 p.c. The rise continued until 1999, followed by a structural declinein 2000, <strong>the</strong> year when RMT <strong>of</strong>ficially ceased trading. This downturn was confirmed in 2001 and <strong>the</strong> trendNBB WORKING PAPER No. 56 - JUNE 2004 51


