

Economic importance of the Flemish maritime ports: Report 2002
Economic importance of the Flemish maritime ports: Report 2002
Economic importance of the Flemish maritime ports: Report 2002

Create successful ePaper yourself
Turn your PDF publications into a flip-book with our unique Google optimized e-Paper software.
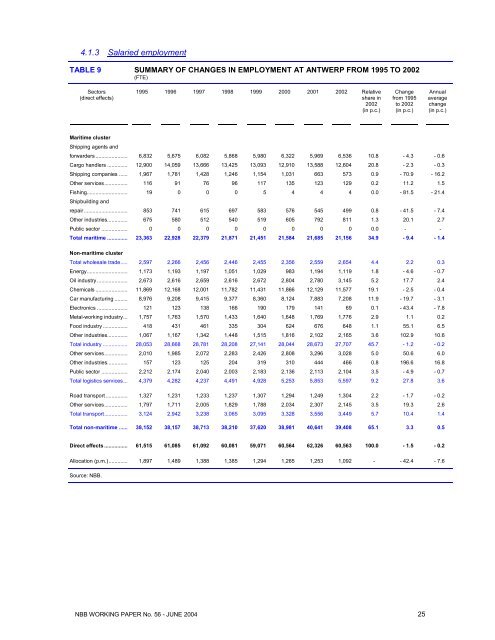
4.1.3 Salaried employmentTABLE 9 SUMMARY OF CHANGES IN EMPLOYMENT AT ANTWERP FROM 1995 TO <strong>2002</strong>(FTE)Sectors(direct effects)1995 1996 1997 1998 1999 2000 2001 <strong>2002</strong> Relativeshare in<strong>2002</strong>(in p.c.)Changefrom 1995to <strong>2002</strong>(in p.c.)Annualaveragechange(in p.c.)Maritime clusterShipping agents andforwarders ...................... 6,832 5,675 6,082 5,868 5,980 6,322 5,969 6,536 10.8 - 4.3 - 0.6Cargo handlers .............. 12,900 14,059 13,666 13,425 13,093 12,910 13,588 12,604 20.8 - 2.3 - 0.3Shipping companies ...... 1,967 1,781 1,428 1,246 1,154 1,031 663 573 0.9 - 70.9 - 16.2O<strong>the</strong>r services................ 116 91 76 96 117 135 123 129 0.2 11.2 1.5Fishing............................ 19 0 0 0 5 4 4 4 0.0 - 81.5 - 21.4Shipbuilding andrepair.............................. 853 741 615 697 583 576 545 499 0.8 - 41.5 - 7.4O<strong>the</strong>r industries.............. 675 580 512 540 519 605 792 811 1.3 20.1 2.7Public sector .................. 0 0 0 0 0 0 0 0 0.0 - -Total <strong>maritime</strong> .............. 23,363 22,928 22,379 21,871 21,451 21,584 21,685 21,156 34.9 - 9.4 - 1.4Non-<strong>maritime</strong> clusterTotal wholesale trade..... 2,597 2,266 2,456 2,446 2,455 2,356 2,559 2,654 4.4 2.2 0.3Energy............................ 1,173 1,193 1,197 1,051 1,029 983 1,194 1,119 1.8 - 4.6 - 0.7Oil industry ..................... 2,673 2,616 2,659 2,616 2,672 2,804 2,780 3,145 5.2 17.7 2.4Chemicals ...................... 11,869 12,168 12,001 11,782 11,431 11,866 12,129 11,577 19.1 - 2.5 - 0.4Car manufacturing ......... 8,976 9,208 9,415 9,377 8,360 8,124 7,883 7,208 11.9 - 19.7 - 3.1Electronics ..................... 121 123 138 166 190 179 141 69 0.1 - 43.4 - 7.8Metal-working industry... 1,757 1,763 1,570 1,433 1,640 1,648 1,769 1,776 2.9 1.1 0.2Food industry ................. 418 431 461 335 304 624 676 648 1.1 55.1 6.5O<strong>the</strong>r industries.............. 1,067 1,167 1,342 1,448 1,515 1,816 2,102 2,165 3.6 102.9 10.6Total industry ................. 28,053 28,668 28,781 28,208 27,141 28,044 28,673 27,707 45.7 - 1.2 - 0.2O<strong>the</strong>r services................ 2,010 1,985 2,072 2,283 2,426 2,808 3,296 3,028 5.0 50.6 6.0O<strong>the</strong>r industries.............. 157 123 125 204 319 310 444 466 0.8 196.6 16.8Public sector .................. 2,212 2,174 2,040 2,003 2,183 2,136 2,113 2,104 3.5 - 4.9 - 0.7Total logistics services... 4,379 4,282 4,237 4,491 4,928 5,253 5,853 5,597 9.2 27.8 3.6Road transport ............... 1,327 1,231 1,233 1,237 1,307 1,294 1,249 1,304 2.2 - 1.7 - 0.2O<strong>the</strong>r services................ 1,797 1,711 2,005 1,829 1,788 2,034 2,307 2,145 3.5 19.3 2.6Total transport................ 3,124 2,942 3,238 3,065 3,095 3,328 3,556 3,449 5.7 10.4 1.4Total non-<strong>maritime</strong> ...... 38,152 38,157 38,713 38,210 37,620 38,981 40,641 39,408 65.1 3.3 0.5Direct effects ................ 61,515 61,085 61,092 60,081 59,071 60,564 62,326 60,563 100.0 - 1.5 - 0.2Allocation (p.m.)............. 1,897 1,489 1,388 1,385 1,294 1,265 1,253 1,092 - - 42.4 - 7.6Source: NBB.NBB WORKING PAPER No. 56 - JUNE 2004 25


