Economic importance of the Flemish maritime ports: Report 2002
Economic importance of the Flemish maritime ports: Report 2002
Economic importance of the Flemish maritime ports: Report 2002
You also want an ePaper? Increase the reach of your titles
YUMPU automatically turns print PDFs into web optimized ePapers that Google loves.
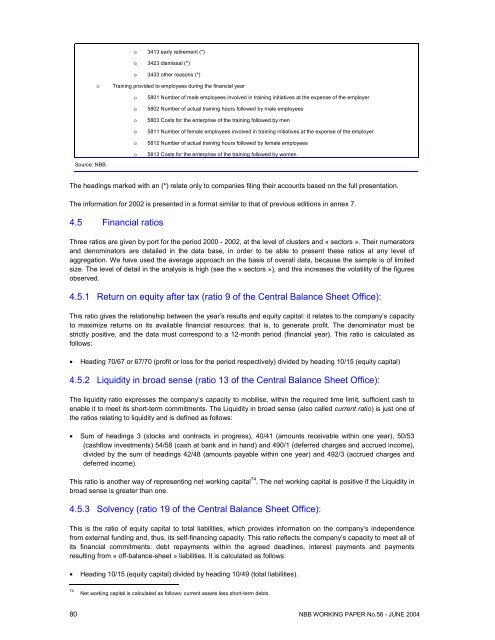
o 3413 early retirement (*)o 3423 dismissal (*)o 3433 o<strong>the</strong>r reasons (*)oTraining provided to employees during <strong>the</strong> financial yearSource: NBB.oooooo5801 Number <strong>of</strong> male employees involved in training initiatives at <strong>the</strong> expense <strong>of</strong> <strong>the</strong> employer5802 Number <strong>of</strong> actual training hours followed by male employees5803 Costs for <strong>the</strong> enterprise <strong>of</strong> <strong>the</strong> training followed by men5811 Number <strong>of</strong> female employees involved in training initiatives at <strong>the</strong> expense <strong>of</strong> <strong>the</strong> employer5812 Number <strong>of</strong> actual training hours followed by female employees5813 Costs for <strong>the</strong> enterprise <strong>of</strong> <strong>the</strong> training followed by womenThe headings marked with an (*) relate only to companies filing <strong>the</strong>ir accounts based on <strong>the</strong> full presentation.The information for <strong>2002</strong> is presented in a format similar to that <strong>of</strong> previous editions in annex 7.4.5 Financial ratiosThree ratios are given by port for <strong>the</strong> period 2000 - <strong>2002</strong>, at <strong>the</strong> level <strong>of</strong> clusters and « sectors ». Their numeratorsand denominators are detailed in <strong>the</strong> data base, in order to be able to present <strong>the</strong>se ratios at any level <strong>of</strong>aggregation. We have used <strong>the</strong> average approach on <strong>the</strong> basis <strong>of</strong> overall data, because <strong>the</strong> sample is <strong>of</strong> limitedsize. The level <strong>of</strong> detail in <strong>the</strong> analysis is high (see <strong>the</strong> « sectors »), and this increases <strong>the</strong> volatility <strong>of</strong> <strong>the</strong> figuresobserved.4.5.1 Return on equity after tax (ratio 9 <strong>of</strong> <strong>the</strong> Central Balance Sheet Office):This ratio gives <strong>the</strong> relationship between <strong>the</strong> year’s results and equity capital: it relates to <strong>the</strong> company’s capacityto maximize returns on its available financial resources: that is, to generate pr<strong>of</strong>it. The denominator must bestrictly positive, and <strong>the</strong> data must correspond to a 12-month period (financial year). This ratio is calculated asfollows:• Heading 70/67 or 67/70 (pr<strong>of</strong>it or loss for <strong>the</strong> period respectively) divided by heading 10/15 (equity capital)4.5.2 Liquidity in broad sense (ratio 13 <strong>of</strong> <strong>the</strong> Central Balance Sheet Office):The liquidity ratio expresses <strong>the</strong> company’s capacity to mobilise, within <strong>the</strong> required time limit, sufficient cash toenable it to meet its short-term commitments. The Liquidity in broad sense (also called current ratio) is just one <strong>of</strong><strong>the</strong> ratios relating to liquidity and is defined as follows:• Sum <strong>of</strong> headings 3 (stocks and contracts in progress), 40/41 (amounts receivable within one year), 50/53(cashflow investments) 54/58 (cash at bank and in hand) and 490/1 (deferred charges and accrued income),divided by <strong>the</strong> sum <strong>of</strong> headings 42/48 (amounts payable within one year) and 492/3 (accrued charges anddeferred income).This ratio is ano<strong>the</strong>r way <strong>of</strong> representing net working capital 74 . The net working capital is positive if <strong>the</strong> Liquidity inbroad sense is greater than one.4.5.3 Solvency (ratio 19 <strong>of</strong> <strong>the</strong> Central Balance Sheet Office):This is <strong>the</strong> ratio <strong>of</strong> equity capital to total liabilities, which provides information on <strong>the</strong> company’s independencefrom external funding and, thus, its self-financing capacity. This ratio reflects <strong>the</strong> company’s capacity to meet all <strong>of</strong>its financial commitments: debt repayments within <strong>the</strong> agreed deadlines, interest payments and paymentsresulting from « <strong>of</strong>f-balance-sheet » liabilities. It is calculated as follows:• Heading 10/15 (equity capital) divided by heading 10/49 (total liabilities).74Net working capital is calculated as follows: current assets less short-term debts.80 NBB WORKING PAPER No.56 - JUNE 2004


