

Economic importance of the Flemish maritime ports: Report 2002
Economic importance of the Flemish maritime ports: Report 2002
Economic importance of the Flemish maritime ports: Report 2002

Create successful ePaper yourself
Turn your PDF publications into a flip-book with our unique Google optimized e-Paper software.
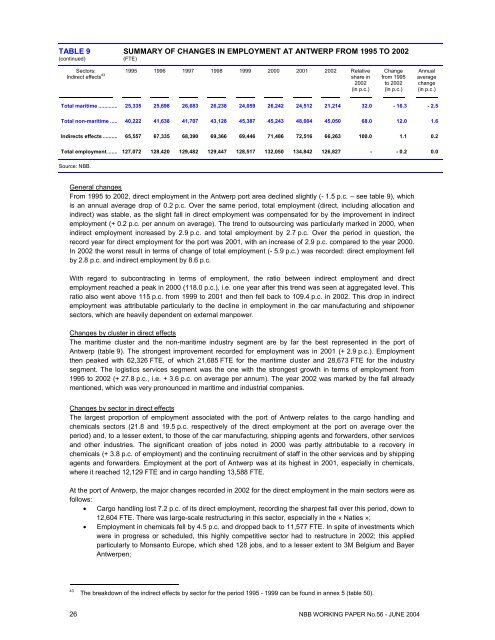
TABLE 9 SUMMARY OF CHANGES IN EMPLOYMENT AT ANTWERP FROM 1995 TO <strong>2002</strong>(continued)(FTE)Sectors:Indirect effects 43 1995 1996 1997 1998 1999 2000 2001 <strong>2002</strong> Relativeshare in<strong>2002</strong>(in p.c.)Changefrom 1995to <strong>2002</strong>(in p.c.)Annualaveragechange(in p.c.)Total <strong>maritime</strong> ............. 25,335 25,698 26,683 26,238 24,059 26,242 24,512 21,214 32.0 - 16.3 - 2.5Total non-<strong>maritime</strong> ..... 40,222 41,638 41,707 43,128 45,387 45,243 48,004 45,050 68.0 12.0 1.6Indirects effects .......... 65,557 67,335 68,390 69,366 69,446 71,486 72,516 66,263 100.0 1.1 0.2Total employment....... 127,072 128,420 129,482 129,447 128,517 132,050 134,842 126,827 - - 0.2 0.0Source: NBB.General changesFrom 1995 to <strong>2002</strong>, direct employment in <strong>the</strong> Antwerp port area declined slightly (- 1.5 p.c. – see table 9), whichis an annual average drop <strong>of</strong> 0.2 p.c. Over <strong>the</strong> same period, total employment (direct, including allocation andindirect) was stable, as <strong>the</strong> slight fall in direct employment was compensated for by <strong>the</strong> improvement in indirectemployment (+ 0.2 p.c. per annum on average). The trend to outsourcing was particularly marked in 2000, whenindirect employment increased by 2.9 p.c. and total employment by 2.7 p.c. Over <strong>the</strong> period in question, <strong>the</strong>record year for direct employment for <strong>the</strong> port was 2001, with an increase <strong>of</strong> 2.9 p.c. compared to <strong>the</strong> year 2000.In <strong>2002</strong> <strong>the</strong> worst result in terms <strong>of</strong> change <strong>of</strong> total employment (- 5.9 p.c.) was recorded: direct employment fellby 2.8 p.c. and indirect employment by 8.6 p.c.With regard to subcontracting in terms <strong>of</strong> employment, <strong>the</strong> ratio between indirect employment and directemployment reached a peak in 2000 (118.0 p.c.), i.e. one year after this trend was seen at aggregated level. Thisratio also went above 115 p.c. from 1999 to 2001 and <strong>the</strong>n fell back to 109.4 p.c. in <strong>2002</strong>. This drop in indirectemployment was attributable particularly to <strong>the</strong> decline in employment in <strong>the</strong> car manufacturing and shipownersectors, which are heavily dependent on external manpower.Changes by cluster in direct effectsThe <strong>maritime</strong> cluster and <strong>the</strong> non-<strong>maritime</strong> industry segment are by far <strong>the</strong> best represented in <strong>the</strong> port <strong>of</strong>Antwerp (table 9). The strongest improvement recorded for employment was in 2001 (+ 2.9 p.c.). Employment<strong>the</strong>n peaked with 62,326 FTE, <strong>of</strong> which 21,685 FTE for <strong>the</strong> <strong>maritime</strong> cluster and 28,673 FTE for <strong>the</strong> industrysegment. The logistics services segment was <strong>the</strong> one with <strong>the</strong> strongest growth in terms <strong>of</strong> employment from1995 to <strong>2002</strong> (+ 27.8 p.c., i.e. + 3.6 p.c. on average per annum). The year <strong>2002</strong> was marked by <strong>the</strong> fall alreadymentioned, which was very pronounced in <strong>maritime</strong> and industrial companies.Changes by sector in direct effectsThe largest proportion <strong>of</strong> employment associated with <strong>the</strong> port <strong>of</strong> Antwerp relates to <strong>the</strong> cargo handling andchemicals sectors (21.8 and 19.5 p.c. respectively <strong>of</strong> <strong>the</strong> direct employment at <strong>the</strong> port on average over <strong>the</strong>period) and, to a lesser extent, to those <strong>of</strong> <strong>the</strong> car manufacturing, shipping agents and forwarders, o<strong>the</strong>r servicesand o<strong>the</strong>r industries. The significant creation <strong>of</strong> jobs noted in 2000 was partly attributable to a recovery inchemicals (+ 3.8 p.c. <strong>of</strong> employment) and <strong>the</strong> continuing recruitment <strong>of</strong> staff in <strong>the</strong> o<strong>the</strong>r services and by shippingagents and forwarders. Employment at <strong>the</strong> port <strong>of</strong> Antwerp was at its highest in 2001, especially in chemicals,where it reached 12,129 FTE and in cargo handling 13,588 FTE.At <strong>the</strong> port <strong>of</strong> Antwerp, <strong>the</strong> major changes recorded in <strong>2002</strong> for <strong>the</strong> direct employment in <strong>the</strong> main sectors were asfollows:• Cargo handling lost 7.2 p.c. <strong>of</strong> its direct employment, recording <strong>the</strong> sharpest fall over this period, down to12,604 FTE. There was large-scale restructuring in this sector, especially in <strong>the</strong> « Naties »;• Employment in chemicals fell by 4.5 p.c. and dropped back to 11,577 FTE. In spite <strong>of</strong> investments whichwere in progress or scheduled, this highly competitive sector had to restructure in <strong>2002</strong>; this appliedparticularly to Monsanto Europe, which shed 128 jobs, and to a lesser extent to 3M Belgium and BayerAntwerpen;43The breakdown <strong>of</strong> <strong>the</strong> indirect effects by sector for <strong>the</strong> period 1995 - 1999 can be found in annex 5 (table 50).26 NBB WORKING PAPER No.56 - JUNE 2004


