

Economic importance of the Flemish maritime ports: Report 2002
Economic importance of the Flemish maritime ports: Report 2002
Economic importance of the Flemish maritime ports: Report 2002

Create successful ePaper yourself
Turn your PDF publications into a flip-book with our unique Google optimized e-Paper software.
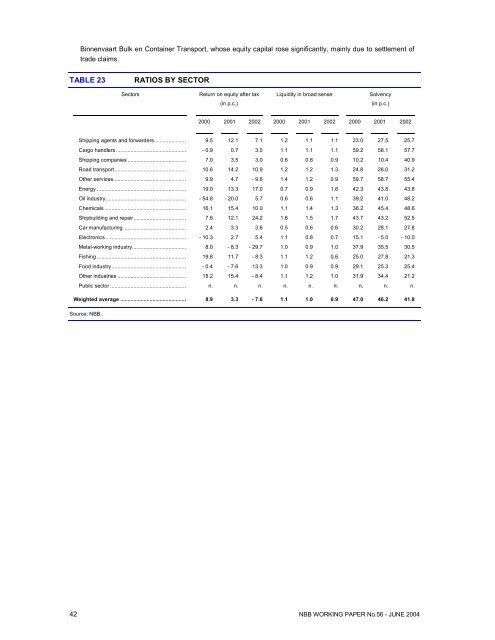
Binnenvaart Bulk en Container Transport, whose equity capital rose significantly, mainly due to settlement <strong>of</strong>trade claims.TABLE 23RATIOS BY SECTORSectorsReturn on equity after taxLiquidity in broad senseSolvency(in p.c.)(in p.c.)2000 2001 <strong>2002</strong> 2000 2001 <strong>2002</strong> 2000 2001 <strong>2002</strong>Shipping agents and forwarders...................... 9.5 12.1 7.1 1.2 1.1 1.1 23.0 27.5 25.7Cargo handlers ................................................ - 0.9 0.7 3.0 1.1 1.1 1.1 59.2 58.1 57.7Shipping companies ........................................ 7.0 3.5 3.0 0.6 0.8 0.9 10.2 10.4 40.9Road transport................................................. 10.6 14.2 10.9 1.2 1.2 1.3 24.8 26.0 31.2O<strong>the</strong>r services.................................................. 9.9 4.7 - 9.6 1.4 1.2 0.9 59.7 58.7 55.4Energy ............................................................. 19.0 13.3 17.0 0.7 0.9 1.6 42.3 43.8 43.8Oil industry....................................................... - 54.8 - 20.0 5.7 0.6 0.6 1.1 39.2 41.0 48.2Chemicals ........................................................ 16.1 15.4 10.0 1.1 1.4 1.3 36.2 45.4 48.6Shipbuilding and repair.................................... 7.6 12.1 24.2 1.6 1.5 1.7 43.7 43.2 52.5Car manufacturing ........................................... 2.4 3.3 3.6 0.5 0.6 0.6 30.2 28.1 27.8Electronics ....................................................... - 10.3 2.7 5.4 1.1 0.8 0.7 15.1 - 5.0 - 10.0Metal-working industry..................................... 8.0 - 8.3 - 29.7 1.0 0.9 1.0 37.9 35.5 30.5Fishing ............................................................. 19.8 11.7 - 8.3 1.1 1.2 0.6 25.0 27.8 21.3Food industry................................................... - 0.4 - 7.6 13.3 1.0 0.9 0.9 29.1 25.3 25.4O<strong>the</strong>r industries ............................................... 15.2 15.4 - 8.4 1.1 1.2 1.0 31.9 34.4 21.2Public sector .................................................... n. n. n. n. n. n. n. n. n.Weighted average ............................................. 8.9 3.3 - 7.6 1.1 1.0 0.9 47.0 46.2 41.8Source: NBB.42 NBB WORKING PAPER No.56 - JUNE 2004


