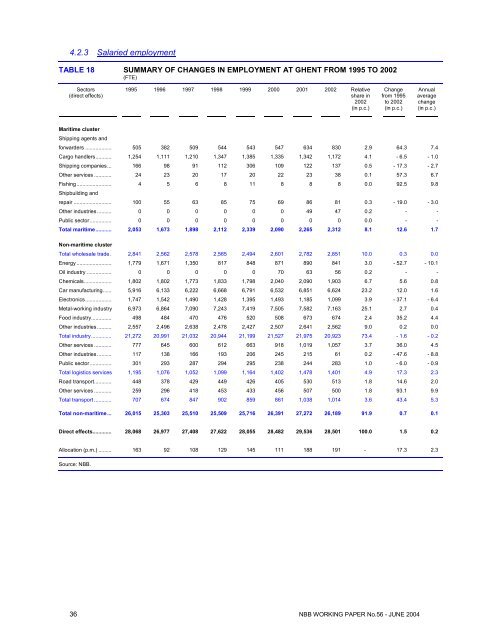
4.2.3 Salaried employmentTABLE 18 SUMMARY OF CHANGES IN EMPLOYMENT AT GHENT FROM 1995 TO <strong>2002</strong>(FTE)Sectors(direct effects)1995 1996 1997 1998 1999 2000 2001 <strong>2002</strong> Relativeshare in<strong>2002</strong>(in p.c.)Changefrom 1995to <strong>2002</strong>(in p.c.)Annualaveragechange(in p.c.)Maritime clusterShipping agents andforwarders .................. 505 382 509 544 543 547 634 830 2.9 64.3 7.4Cargo handlers........... 1,254 1,111 1,210 1,347 1,385 1,335 1,342 1,172 4.1 - 6.5 - 1.0Shipping companies... 166 98 91 112 306 109 122 137 0.5 - 17.3 - 2.7O<strong>the</strong>r services ............ 24 23 20 17 20 22 23 38 0.1 57.3 6.7Fishing........................ 4 5 6 8 11 8 8 8 0.0 92.5 9.8Shipbuilding andrepair .......................... 100 55 63 85 75 69 86 81 0.3 - 19.0 - 3.0O<strong>the</strong>r industries.......... 0 0 0 0 0 0 49 47 0.2 - -Public sector............... 0 0 0 0 0 0 0 0 0.0 - -Total <strong>maritime</strong>........... 2,053 1,673 1,898 2,112 2,339 2,090 2,265 2,312 8.1 12.6 1.7Non-<strong>maritime</strong> clusterTotal wholesale trade . 2,841 2,562 2,578 2,565 2,494 2,601 2,782 2,851 10.0 0.3 0.0Energy ........................ 1,779 1,671 1,350 817 848 871 890 841 3.0 - 52.7 - 10.1Oil industry ................. 0 0 0 0 0 70 63 56 0.2 - -Chemicals................... 1,802 1,802 1,773 1,833 1,798 2,040 2,090 1,903 6.7 5.6 0.8Car manufacturing...... 5,916 6,133 6,222 6,668 6,791 6,532 6,851 6,624 23.2 12.0 1.6Electronics.................. 1,747 1,542 1,490 1,428 1,395 1,493 1,185 1,099 3.9 - 37.1 - 6.4Metal-working industry 6,973 6,864 7,090 7,243 7,419 7,505 7,582 7,163 25.1 2.7 0.4Food industry.............. 498 484 470 476 520 508 673 674 2.4 35.2 4.4O<strong>the</strong>r industries.......... 2,557 2,496 2,638 2,478 2,427 2,507 2,641 2,562 9.0 0.2 0.0Total industry.............. 21,272 20,991 21,032 20,944 21,199 21,527 21,975 20,923 73.4 - 1.6 - 0.2O<strong>the</strong>r services ............ 777 645 600 612 663 918 1,019 1,057 3.7 36.0 4.5O<strong>the</strong>r industries.......... 117 138 166 193 206 245 215 61 0.2 - 47.6 - 8.8Public sector............... 301 293 287 294 295 238 244 283 1.0 - 6.0 - 0.9Total logistics services 1,195 1,076 1,052 1,099 1,164 1,402 1,478 1,401 4.9 17.3 2.3Road transport............ 448 378 429 449 426 405 530 513 1.8 14.6 2.0O<strong>the</strong>r services ............ 259 296 418 453 433 456 507 500 1.8 93.1 9.9Total transport ............ 707 674 847 902 859 861 1,038 1,014 3.6 43.4 5.3Total non-<strong>maritime</strong>... 26,015 25,303 25,510 25,509 25,716 26,391 27,272 26,189 91.9 0.7 0.1Direct effects............. 28,068 26,977 27,408 27,622 28,055 28,482 29,536 28,501 100.0 1.5 0.2Allocation (p.m.) ......... 163 92 108 129 145 111 188 191 - 17.3 2.3Source: NBB.36 NBB WORKING PAPER No.56 - JUNE 2004
TABLEAU 18 SUMMARY OF CHANGES IN EMPLOYMENT AT GHENT FROM 1995 TO <strong>2002</strong>(continued)(FTE)Sectors:(indirect effects 47 )1995 1996 1997 1998 1999 2000 2001 <strong>2002</strong> Relativeshare in<strong>2002</strong>(in p.c.)Change1995 -<strong>2002</strong>(in p.c.)Annualaveragechange(in p.c.)Total <strong>maritime</strong> .............. 2,231 1,850 2,188 2,519 3,340 2,628 3,126 3,122 9.4 39.9 4.9Total non-<strong>maritime</strong> ...... 26,382 26,506 25,915 26,950 29,686 29,505 31,133 30,110 90.6 14.1 1.9Indirect effects ............. 28,613 28,355 28,102 29,469 33,027 32,133 34,259 33,233 100.0 16.1 2.2Total employment ........ 56,681 55,332 55,511 57,091 61,081 60,615 63,795 61,733 - 8.9 1.2Source: NBB.General changesDirect employment in <strong>the</strong> Ghent port area (including allocation) rose by 1.5 p.c. from 1995 to <strong>2002</strong>, i.e. 0.2 p.c. asan annual average (table 18). Total employment (including indirect effects) rose more strongly by 8.9 p.c. over<strong>the</strong>se seven years, i.e. + 1.2 p.c. as an annual average. As with <strong>the</strong> VA <strong>of</strong> companies established at Ghent, thisrise was due above all to subcontracting, since indirect employment increased over <strong>the</strong> same period by 16.1 p.c.,i.e. 2.2 p.c. as an annual average. The years 1999 and 2001 were marked by <strong>the</strong> greatest creation <strong>of</strong> jobs,especially in subcontracting. Indirect employment in those years rose by 12.1 and 6.6 p.c. respectively, while in<strong>the</strong> same two years direct employment only increased by 1.6 and 3.7 p.c. This difference may be attributed to <strong>the</strong>increase in employment in sectors which are heavily dependent on subcontracting, such as <strong>the</strong> metal-working,chemicals and car manufacturing industries. 1999 was <strong>the</strong> year with <strong>the</strong> most marked total rise (+ 7.0 p.c.), and2001 <strong>the</strong> year with <strong>the</strong> largest number <strong>of</strong> jobs (29,536 direct FTE and 63,795 FTE total). As for <strong>the</strong> port <strong>of</strong>Antwerp, <strong>2002</strong> was marked by <strong>the</strong> decline in direct employment (- 3.5 p.c., almost as great as <strong>the</strong> drop <strong>of</strong> 3.9 p.c.recorded in 1996) and total employment (- 3.2 p.c.).The ratio <strong>of</strong> indirect employment to direct employment remained high in <strong>2002</strong>. As for <strong>the</strong> total for <strong>the</strong> four <strong>ports</strong>,1999 showed a record (117.7 p.c.). This ratio <strong>the</strong>n decreased slightly before returning in <strong>2002</strong> to a relatively highlevel (116.6 p.c.). The drop in indirect employment at that time was due above all to <strong>the</strong> decline in employment in<strong>the</strong> chemicals and car manufacturing sectors, which are heavily dependent on subcontracting. But <strong>the</strong> effect waslimited because <strong>of</strong> <strong>the</strong> recovery in employment by shipping companies.Changes by cluster in direct effectsThe industry segment employs <strong>the</strong> majority <strong>of</strong> those working in <strong>the</strong> port, i.e. 75.6 p.c. on average over <strong>the</strong> periodin question. This proportion is only 9.5 and 7.4 p.c. respectively for wholesale trade and <strong>the</strong> <strong>maritime</strong> cluster. Thelargest rise in direct employment (including allocation) was seen in 2001: employment in <strong>the</strong> <strong>maritime</strong> clusterincreased by 8.4 p.c. and that in industry by 2.1 p.c. Although not as large, logistics services and transport over<strong>the</strong>se seven years recorded <strong>the</strong>ir best average rises in direct employment (+ 2.3 and + 5.3 p.c. respectively). In<strong>2002</strong>, <strong>the</strong> decline <strong>of</strong> 3.5 p.c. in direct employment in <strong>the</strong> port <strong>of</strong> Ghent was above all due to <strong>the</strong> drop seen inindustry (- 4.8 p.c.).Changes by sector in direct effectsJobs at <strong>the</strong> port <strong>of</strong> Ghent are centred mainly on <strong>the</strong> metal-working and car manufacturing industries and, to alesser extent, <strong>the</strong> o<strong>the</strong>r services, <strong>the</strong> chemicals and o<strong>the</strong>r industries. 2001 was an excellent year for employment,with <strong>the</strong> workforce <strong>of</strong> <strong>the</strong> metal-working industry amounting to 7,582 FTE. The same year, employment in <strong>the</strong> carmanufacturing and chemicals industries reached 6,851 and 2,090 FTE respectively. That is when <strong>the</strong> <strong>2002</strong>decline referred to above started.47The breakdown <strong>of</strong> <strong>the</strong> indirect effects by sector for <strong>the</strong> period 1995- 1999 can be found in annex 5 (table 52).NBB WORKING PAPER No. 56 - JUNE 2004 37