

J. C. Penney Company, Inc. Equity Valuation and Analysis As of ...
J. C. Penney Company, Inc. Equity Valuation and Analysis As of ...
J. C. Penney Company, Inc. Equity Valuation and Analysis As of ...

Create successful ePaper yourself
Turn your PDF publications into a flip-book with our unique Google optimized e-Paper software.
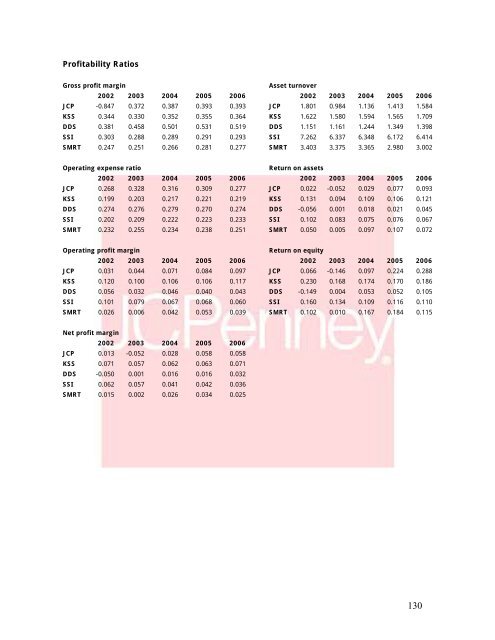
Pr<strong>of</strong>itability RatiosGross pr<strong>of</strong>it margin<strong>As</strong>set turnover2002 2003 2004 2005 2006 2002 2003 2004 2005 2006JCP -0.847 0.372 0.387 0.393 0.393 JCP 1.801 0.984 1.136 1.413 1.584KSS 0.344 0.330 0.352 0.355 0.364 KSS 1.622 1.580 1.594 1.565 1.709DDS 0.381 0.458 0.501 0.531 0.519 DDS 1.151 1.161 1.244 1.349 1.398SSI 0.303 0.288 0.289 0.291 0.293 SSI 7.262 6.337 6.348 6.172 6.414SMRT 0.247 0.251 0.266 0.281 0.277 SMRT 3.403 3.375 3.365 2.980 3.002Operating expense ratioReturn on assets2002 2003 2004 2005 2006 2002 2003 2004 2005 2006JCP 0.268 0.328 0.316 0.309 0.277 JCP 0.022 -0.052 0.029 0.077 0.093KSS 0.199 0.203 0.217 0.221 0.219 KSS 0.131 0.094 0.109 0.106 0.121DDS 0.274 0.276 0.279 0.270 0.274 DDS -0.056 0.001 0.018 0.021 0.045SSI 0.202 0.209 0.222 0.223 0.233 SSI 0.102 0.083 0.075 0.076 0.067SMRT 0.232 0.255 0.234 0.238 0.251 SMRT 0.050 0.005 0.097 0.107 0.072Operating pr<strong>of</strong>it marginReturn on equity2002 2003 2004 2005 2006 2002 2003 2004 2005 2006JCP 0.031 0.044 0.071 0.084 0.097 JCP 0.066 -0.146 0.097 0.224 0.288KSS 0.120 0.100 0.106 0.106 0.117 KSS 0.230 0.168 0.174 0.170 0.186DDS 0.056 0.032 0.046 0.040 0.043 DDS -0.149 0.004 0.053 0.052 0.105SSI 0.101 0.079 0.067 0.068 0.060 SSI 0.160 0.134 0.109 0.116 0.110SMRT 0.026 0.006 0.042 0.053 0.039 SMRT 0.102 0.010 0.167 0.184 0.115Net pr<strong>of</strong>it margin2002 2003 2004 2005 2006JCP 0.013 -0.052 0.028 0.058 0.058KSS 0.071 0.057 0.062 0.063 0.071DDS -0.050 0.001 0.016 0.016 0.032SSI 0.062 0.057 0.041 0.042 0.036SMRT 0.015 0.002 0.026 0.034 0.025130


