

J. C. Penney Company, Inc. Equity Valuation and Analysis As of ...
J. C. Penney Company, Inc. Equity Valuation and Analysis As of ...
J. C. Penney Company, Inc. Equity Valuation and Analysis As of ...

Create successful ePaper yourself
Turn your PDF publications into a flip-book with our unique Google optimized e-Paper software.
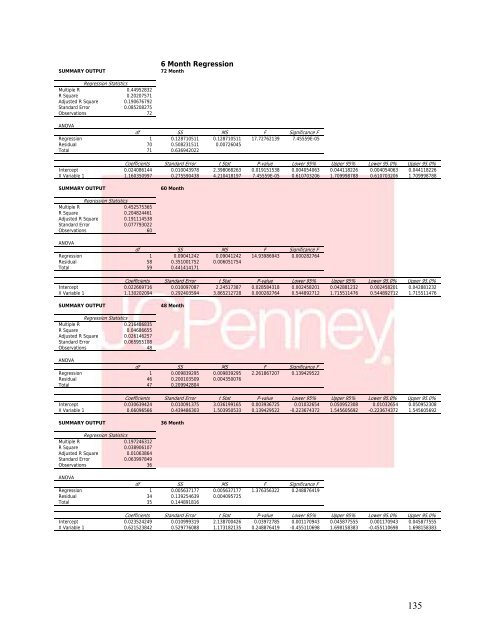
SUMMARY OUTPUT6 Month Regression72 MonthRegression StatisticsMultiple R 0.44952832R Square 0.20207571Adjusted R Square 0.190676792St<strong>and</strong>ard Error 0.085208275Observations 72ANOVAdf SS MS F Significance FRegression 1 0.128710511 0.128710511 17.72762139 7.45559E-05Residual 70 0.508231511 0.00726045Total 71 0.636942022Coefficients St<strong>and</strong>ard Error t Stat P-value Lower 95% Upper 95% Lower 95.0% Upper 95.0%Intercept 0.024086144 0.010043978 2.398068263 0.019151538 0.004054063 0.044118226 0.004054063 0.044118226X Variable 1 1.160350997 0.275590438 4.210418197 7.45559E-05 0.610703206 1.709998788 0.610703206 1.709998788SUMMARY OUTPUT60 MonthRegression StatisticsMultiple R 0.452575365R Square 0.204824461Adjusted R Square 0.191114538St<strong>and</strong>ard Error 0.077793022Observations 60ANOVAdf SS MS F Significance FRegression 1 0.09041242 0.09041242 14.93986943 0.000282764Residual 58 0.351001752 0.006051754Total 59 0.441414171Coefficients St<strong>and</strong>ard Error t Stat P-value Lower 95% Upper 95% Lower 95.0% Upper 95.0%Intercept 0.022669716 0.010097087 2.24517387 0.028584318 0.002458201 0.042881232 0.002458201 0.042881232X Variable 1 1.130202094 0.292403594 3.865212728 0.000282764 0.544892712 1.715511476 0.544892712 1.715511476SUMMARY OUTPUT48 MonthRegression StatisticsMultiple R 0.216486835R Square 0.04686655Adjusted R Square 0.026146257St<strong>and</strong>ard Error 0.065955108Observations 48ANOVAdf SS MS F Significance FRegression 1 0.009839295 0.009839295 2.261867207 0.139429522Residual 46 0.200103509 0.004350076Total 47 0.209942804Coefficients St<strong>and</strong>ard Error t Stat P-value Lower 95% Upper 95% Lower 95.0% Upper 95.0%Intercept 0.030639424 0.010091375 3.036199165 0.003936725 0.01032654 0.050952308 0.01032654 0.050952308X Variable 1 0.66096566 0.439486303 1.503950533 0.139429522 -0.223674372 1.545605692 -0.223674372 1.545605692SUMMARY OUTPUT36 MonthRegression StatisticsMultiple R 0.197246312R Square 0.038906107Adjusted R Square 0.01063864St<strong>and</strong>ard Error 0.063997849Observations 36ANOVAdf SS MS F Significance FRegression 1 0.005637177 0.005637177 1.376356322 0.248876419Residual 34 0.139254639 0.004095725Total 35 0.144891816Coefficients St<strong>and</strong>ard Error t Stat P-value Lower 95% Upper 95% Lower 95.0% Upper 95.0%Intercept 0.023524249 0.010999319 2.138700426 0.03972785 0.001170943 0.045877555 0.001170943 0.045877555X Variable 1 0.621523842 0.529776088 1.173182135 0.248876419 -0.455110698 1.698158383 -0.455110698 1.698158383135


