- Page 1 and 2:
J. C. Penney Company, Inc. Equity V
- Page 5 and 6:
Industry AnalysisIn 1902, James Cas
- Page 7 and 8:
Financial Analysis, Forecast Financ
- Page 9 and 10:
Business & Industry AnalysisCompany
- Page 11 and 12:
Industry OverviewThe retail industr
- Page 13 and 14:
Five Forces ModelThe Five Forces Mo
- Page 15 and 16:
ConcentrationThe level of concentra
- Page 17 and 18:
capable of offering lower prices th
- Page 19 and 20:
If a firm wishes to shut down, it m
- Page 21 and 22:
Legal BarriersMany industries have
- Page 24 and 25:
These costs include issues such as
- Page 26 and 27:
Bargaining Power of SuppliersThe de
- Page 28 and 29:
The relative bargaining power of th
- Page 30 and 31:
Competitive StrategiesIn order to a
- Page 32 and 33:
Department stores have to focus on
- Page 34 and 35:
The Big PicturePlayers in this indu
- Page 36 and 37:
Lower Input CostsJ. C. Penney is at
- Page 38 and 39:
in the last five years. This trend
- Page 40 and 41:
convenient for different consumers
- Page 42 and 43:
transactions have been improperly s
- Page 44 and 45:
Penney does state in its annual rep
- Page 46 and 47:
Operating and Capital LeasesOperati
- Page 48 and 49:
Potential Accounting FlexibilityA f
- Page 50 and 51:
truly are. J. C. Penney, however, h
- Page 52 and 53:
Qualitative Analysis of DisclosureT
- Page 54 and 55:
we can see why targeting the strong
- Page 56 and 57:
manipulation diagnostics for J. C.
- Page 58 and 59:
Net Sales/Net Accounts ReceivableNe
- Page 60 and 61:
Net Sales/Unearned Revenue1200Net S
- Page 62 and 63:
Below is a chart of sales manipulat
- Page 64 and 65:
As for the industry, all the compan
- Page 66 and 67:
Pension Expense/SG&APension Expense
- Page 68 and 69:
Below is a chart of all expense man
- Page 70 and 71:
discount rates in respect to pensio
- Page 72 and 73:
Financial Analysis, Forecast Financ
- Page 74 and 75:
paying off their short-term obligat
- Page 76 and 77:
ecause many firms in this segment o
- Page 78 and 79:
Penney’s inventory turnover is in
- Page 80 and 81:
ConclusionAnalysis through liquidit
- Page 82 and 83:
operating efficiency because the fi
- Page 84 and 85:
Return on AssetsReturn on Assets0.1
- Page 86 and 87:
Capital Structure AnalysisWhen look
- Page 88 and 89:
however, in 2006, J. C. Penney show
- Page 90 and 91:
Sustainable Growth RateSustainable
- Page 92 and 93:
average of only years 2005 and 2006
- Page 94 and 95:
(reported in millions)Annual Income
- Page 96 and 97: We then began to look at the equity
- Page 98 and 99: Common Size Balance Sheet 2002 2003
- Page 100 and 101: (numbers in millions)Statement of C
- Page 102 and 103: ConclusionOverall, it appears that
- Page 104 and 105: Inc. We set these averages equal to
- Page 106 and 107: Price to BookPPS BPS P/B IndustryAv
- Page 108 and 109: Price Earnings GrowthPPS EPS PEG In
- Page 110 and 111: y J. C. Penney’s EBITDA. Then we
- Page 112 and 113: Regression Analysis3 Month Rate 72
- Page 114 and 115: Intrinsic ValuationsIntrinsic valua
- Page 116 and 117: amount in the eye’s of shareholde
- Page 118 and 119: This particular stock price in our
- Page 120 and 121: esidual income or converge. Future
- Page 122 and 123: To find our long run return on equi
- Page 124 and 125: Sensitivity AnalysisGrowth Rates0 -
- Page 126 and 127: for this large difference between s
- Page 128 and 129: Analyst RecommendationAfter careful
- Page 130 and 131: AppendixLiquidity RatiosCurrent rat
- Page 132 and 133: Capital Structure RatioDebt to equi
- Page 134 and 135: SUMMARY OUTPUT3 Month Regression72
- Page 136 and 137: SUMMARY OUTPUT6 Month Regression72
- Page 138 and 139: SUMMARY OUTPUT2 Year Regression72 M
- Page 140 and 141: SUMMARY OUTPUT5 Year Regression72 M
- Page 142 and 143: SUMMARY OUTPUT10 Year Regression72
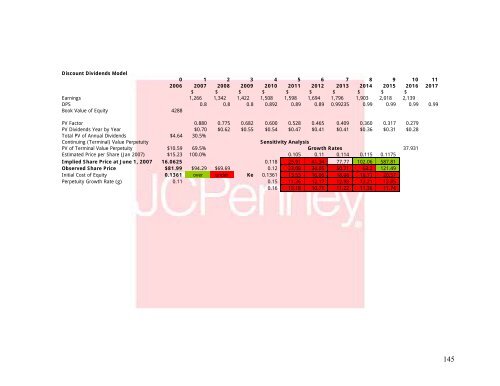
- Page 144 and 145: Cost of Equity 0.1361Estimated Pric
- Page 148 and 149: Residual Income Model WACC(AT) 0.07
- Page 150 and 151: Z-Score AnalysisZ-Score=1.21.43.320