(reported in millions)Annual <strong>Inc</strong>ome Statement 2002 2003 2004 2005 2006 Average Avg 05-06 Ind. Avg. <strong>As</strong>sumed 2007 2008 2009 2010 2011 2012 2013 2014 2015 2016Retail sales, net $32,347 $17,786 $18,424 $18,781 $19,903 100.00% 100.00% 100.00% 6.00% $21,097 $22,363 $23,705 $25,127 $26,635 $28,233 $29,927 $31,722 $33,626 $35,643Cost <strong>of</strong> goods sold $22,573 $11,166 $11,285 $11,405 $12,078 -6.49% 3.96% 9.52% 61.00% $12,869 $13,641 $14,460 $15,328 $16,247 $17,222 $18,255 $19,351 $20,512 $21,742Gross margin $9,774 $6,620 $7,139 $7,376 $7,825 63.05% 60.71% 67.82% 39.00% $8,228 $8,722 $9,245 $9,800 $10,388 $11,011 $11,671 $12,372 $13,114 $13,901Selling, general & administrative expenses $8,667 $5,830 $5,827 $5,799 $5,521 36.95% 39.29% 32.81% 29.25% $6,171 $6,541 $6,934 $7,350 $7,791 $8,258 $8,754 $9,279 $9,836 $10,426Total operating expenses $8,667 $5,830 $5,827 $5,799 $5,903 30.35% 30.27% 26.69% 30.25% $6,382 $6,765 $7,171 $7,601 $8,057 $8,540 $9,053 $9,596 $10,172 $10,782Operating income $1,107 $790 $1,312 $1,577 $1,922 6.61% 9.03% 6.53% 8.75% $1,846 $1,957 $2,074 $2,199 $2,331 $2,470 $2,619 $2,776 $2,942 $3,119Total costs & expenses $31,763 $17,336 $17,442 $17,403 $18,179 94.87% 92.00% 93.56% 90.50% $19,093 $20,239 $21,453 $22,740 $24,104 $25,551 $27,084 $28,709 $30,431 $32,257<strong>Inc</strong>ome tax expense $213 $182 $353 $467 $658 1.88% 2.90% 2.05% 3.50% $738 $783 $830 $879 $932 $988 $1,047 $1,110 $1,177 $1,248Net income (loss) $405 ($928) $524 $1,088 $1,153 2.09% 5.79% 3.13% 6.00% $1,266 $1,342 $1,422 $1,508 $1,598 $1,694 $1,796 $1,903 $2,018 $2,139Common Size <strong>Inc</strong>ome Statement 2002 2003 2004 2005 2006 Average Avg 05-06 Ind. Avg. <strong>As</strong>sumed 2007 2008 2009 2010 2011 2012 2013 2014 2015 2016Sales Growth Percent 1.07% -45.01% 3.59% 1.94% 5.97% -6.49% 3.96% 9.52% 6.00% 6.00% 6.00% 6.00% 6.00% 6.00% 6.00% 6.00% 6.00% 6.00% 6.00%Cost <strong>of</strong> goods sold 69.78% 62.78% 61.25% 60.73% 60.68% 63.05% 60.71% 67.82% 61.00% 61.00% 61.00% 61.00% 61.00% 61.00% 61.00% 61.00% 61.00% 61.00% 61.00%Gross margin 30.22% 37.22% 38.75% 39.27% 39.32% 36.95% 39.29% 32.81% 39.00% 39.00% 39.00% 39.00% 39.00% 39.00% 39.00% 39.00% 39.00% 39.00% 39.00%Selling, general & administrative expenses 26.79% 32.78% 31.63% 30.88% 27.74% 29.96% 29.31% 24.87% 29.25% 29.25% 29.25% 29.25% 29.25% 29.25% 29.25% 29.25% 29.25% 29.25% 29.25%Total operating expenses 26.79% 32.78% 31.63% 30.88% 29.66% 30.35% 30.27% 26.69% 31.00% 31.00% 31.00% 31.00% 31.00% 31.00% 31.00% 31.00% 31.00% 31.00% 31.00%Operating income 3.42% 4.44% 7.12% 8.40% 9.66% 6.61% 9.03% 6.53% 10.00% 10.00% 10.00% 10.00% 10.00% 10.00% 10.00% 10.00% 10.00% 10.00% 10.00%Total costs & expenses 98.19% 97.47% 94.67% 92.66% 91.34% 94.87% 92.00% 93.56% 90.50% 90.50% 90.50% 90.50% 90.50% 90.50% 90.50% 90.50% 90.50% 90.50% 90.50%<strong>Inc</strong>ome tax expense 0.66% 1.02% 1.92% 2.49% 3.31% 1.88% 2.90% 2.05% 3.50% 3.50% 3.50% 3.50% 3.50% 3.50% 3.50% 3.50% 3.50% 3.50% 3.50%Net income (loss) 1.25% -5.22% 2.84% 5.79% 5.79% 2.09% 5.79% 3.13% 6.00% 6.00% 6.00% 6.00% 6.00% 6.00% 6.00% 6.00% 6.00% 6.00% 6.00%93
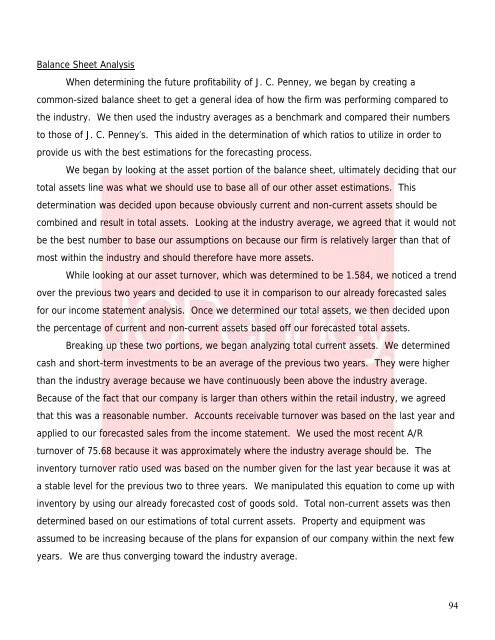
Balance Sheet <strong>Analysis</strong>When determining the future pr<strong>of</strong>itability <strong>of</strong> J. C. <strong>Penney</strong>, we began by creating acommon-sized balance sheet to get a general idea <strong>of</strong> how the firm was performing compared tothe industry. We then used the industry averages as a benchmark <strong>and</strong> compared their numbersto those <strong>of</strong> J. C. <strong>Penney</strong>’s. This aided in the determination <strong>of</strong> which ratios to utilize in order toprovide us with the best estimations for the forecasting process.We began by looking at the asset portion <strong>of</strong> the balance sheet, ultimately deciding that ourtotal assets line was what we should use to base all <strong>of</strong> our other asset estimations. Thisdetermination was decided upon because obviously current <strong>and</strong> non-current assets should becombined <strong>and</strong> result in total assets. Looking at the industry average, we agreed that it would notbe the best number to base our assumptions on because our firm is relatively larger than that <strong>of</strong>most within the industry <strong>and</strong> should therefore have more assets.While looking at our asset turnover, which was determined to be 1.584, we noticed a trendover the previous two years <strong>and</strong> decided to use it in comparison to our already forecasted salesfor our income statement analysis. Once we determined our total assets, we then decided uponthe percentage <strong>of</strong> current <strong>and</strong> non-current assets based <strong>of</strong>f our forecasted total assets.Breaking up these two portions, we began analyzing total current assets. We determinedcash <strong>and</strong> short-term investments to be an average <strong>of</strong> the previous two years. They were higherthan the industry average because we have continuously been above the industry average.Because <strong>of</strong> the fact that our company is larger than others within the retail industry, we agreedthat this was a reasonable number. Accounts receivable turnover was based on the last year <strong>and</strong>applied to our forecasted sales from the income statement. We used the most recent A/Rturnover <strong>of</strong> 75.68 because it was approximately where the industry average should be. Theinventory turnover ratio used was based on the number given for the last year because it was ata stable level for the previous two to three years. We manipulated this equation to come up withinventory by using our already forecasted cost <strong>of</strong> goods sold. Total non-current assets was thendetermined based on our estimations <strong>of</strong> total current assets. Property <strong>and</strong> equipment wasassumed to be increasing because <strong>of</strong> the plans for expansion <strong>of</strong> our company within the next fewyears. We are thus converging toward the industry average.94
- Page 1 and 2:
J. C. Penney Company, Inc. Equity V
- Page 5 and 6:
Industry AnalysisIn 1902, James Cas
- Page 7 and 8:
Financial Analysis, Forecast Financ
- Page 9 and 10:
Business & Industry AnalysisCompany
- Page 11 and 12:
Industry OverviewThe retail industr
- Page 13 and 14:
Five Forces ModelThe Five Forces Mo
- Page 15 and 16:
ConcentrationThe level of concentra
- Page 17 and 18:
capable of offering lower prices th
- Page 19 and 20:
If a firm wishes to shut down, it m
- Page 21 and 22:
Legal BarriersMany industries have
- Page 24 and 25:
These costs include issues such as
- Page 26 and 27:
Bargaining Power of SuppliersThe de
- Page 28 and 29:
The relative bargaining power of th
- Page 30 and 31:
Competitive StrategiesIn order to a
- Page 32 and 33:
Department stores have to focus on
- Page 34 and 35:
The Big PicturePlayers in this indu
- Page 36 and 37:
Lower Input CostsJ. C. Penney is at
- Page 38 and 39:
in the last five years. This trend
- Page 40 and 41:
convenient for different consumers
- Page 42 and 43:
transactions have been improperly s
- Page 44 and 45: Penney does state in its annual rep
- Page 46 and 47: Operating and Capital LeasesOperati
- Page 48 and 49: Potential Accounting FlexibilityA f
- Page 50 and 51: truly are. J. C. Penney, however, h
- Page 52 and 53: Qualitative Analysis of DisclosureT
- Page 54 and 55: we can see why targeting the strong
- Page 56 and 57: manipulation diagnostics for J. C.
- Page 58 and 59: Net Sales/Net Accounts ReceivableNe
- Page 60 and 61: Net Sales/Unearned Revenue1200Net S
- Page 62 and 63: Below is a chart of sales manipulat
- Page 64 and 65: As for the industry, all the compan
- Page 66 and 67: Pension Expense/SG&APension Expense
- Page 68 and 69: Below is a chart of all expense man
- Page 70 and 71: discount rates in respect to pensio
- Page 72 and 73: Financial Analysis, Forecast Financ
- Page 74 and 75: paying off their short-term obligat
- Page 76 and 77: ecause many firms in this segment o
- Page 78 and 79: Penney’s inventory turnover is in
- Page 80 and 81: ConclusionAnalysis through liquidit
- Page 82 and 83: operating efficiency because the fi
- Page 84 and 85: Return on AssetsReturn on Assets0.1
- Page 86 and 87: Capital Structure AnalysisWhen look
- Page 88 and 89: however, in 2006, J. C. Penney show
- Page 90 and 91: Sustainable Growth RateSustainable
- Page 92 and 93: average of only years 2005 and 2006
- Page 96 and 97: We then began to look at the equity
- Page 98 and 99: Common Size Balance Sheet 2002 2003
- Page 100 and 101: (numbers in millions)Statement of C
- Page 102 and 103: ConclusionOverall, it appears that
- Page 104 and 105: Inc. We set these averages equal to
- Page 106 and 107: Price to BookPPS BPS P/B IndustryAv
- Page 108 and 109: Price Earnings GrowthPPS EPS PEG In
- Page 110 and 111: y J. C. Penney’s EBITDA. Then we
- Page 112 and 113: Regression Analysis3 Month Rate 72
- Page 114 and 115: Intrinsic ValuationsIntrinsic valua
- Page 116 and 117: amount in the eye’s of shareholde
- Page 118 and 119: This particular stock price in our
- Page 120 and 121: esidual income or converge. Future
- Page 122 and 123: To find our long run return on equi
- Page 124 and 125: Sensitivity AnalysisGrowth Rates0 -
- Page 126 and 127: for this large difference between s
- Page 128 and 129: Analyst RecommendationAfter careful
- Page 130 and 131: AppendixLiquidity RatiosCurrent rat
- Page 132 and 133: Capital Structure RatioDebt to equi
- Page 134 and 135: SUMMARY OUTPUT3 Month Regression72
- Page 136 and 137: SUMMARY OUTPUT6 Month Regression72
- Page 138 and 139: SUMMARY OUTPUT2 Year Regression72 M
- Page 140 and 141: SUMMARY OUTPUT5 Year Regression72 M
- Page 142 and 143: SUMMARY OUTPUT10 Year Regression72
- Page 144 and 145:
Cost of Equity 0.1361Estimated Pric
- Page 146 and 147:
Discount Dividends Model0 1 2 3 4 5
- Page 148 and 149:
Residual Income Model WACC(AT) 0.07
- Page 150 and 151:
Z-Score AnalysisZ-Score=1.21.43.320